-2.png?height=120&name=EDITED%20Logo%20Dark%20-%20Color%20(1)-2.png)
You must set the filters at the top of your dashboard to ensure the widgets in your dashboard populate with data.
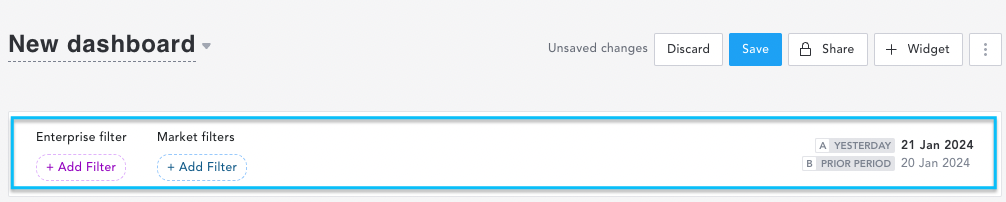
Filter Pills
Depending on the filter pill that you select at the top of your dashboard, different filter panels will appear on the right side of the page for you to select your dataset. You can select Enterprise filter and/or Market filter depending on your EDITED subscription, and the date filter.
- Enterprise filter: these are the internal business metrics our customers feed into EDITED Digital or Omni.
- Market filter: this will give you access to filters based on the data found within EDITED Market.
- Date selector - allows you to select the time periods analyzed in your dashboard. The data in your widgets will reflect the products that were in stock over that period.
- +Comparisons (activated once you have selected Market filters) allows you to select two Market data fields to compare. Such as the data for two different retailers, categories or countries or compare one retailer against an aggregate of all other retailers in your selection.

Adding Filters
Enterprise filters will be greyed out if you’re not a customer of EDITED Omni or Digital, and Market filters will be greyed out if you’re not a customer of EDITED Market.
- Enterprise customers: Click on the Add Filter pill at the top of your dashboard.

- A filter panel will appear to the right of your screen prompting you to select from the list of fields.

- EDITED Market customers: Click the Add Filter pill at the top of your dashboard. If you subscribe to multiple verticals, such as Apparel, Homeware and Beauty, select the vertical you’d like to analyze within the dashboard.

- On doing this, the right-hand filter panel will appear.

Use the Apply button to apply your chosen filter and Add condition to select more filters. You can use any number of filters, in any combination.
Remember - the content of your entire dashboard will be a reflection of the filters you have applied in your filter panel.

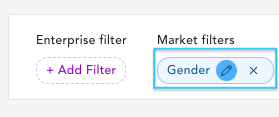
- Clicking the pencil icon at the top right of the filter panel will allow you to rename your filter set.
- The X icon will close the filter panel.

- You can also rename your filter set by hovering over the top filter panel pills and clicking on the pencil icon.
Selecting Dates to Analyze
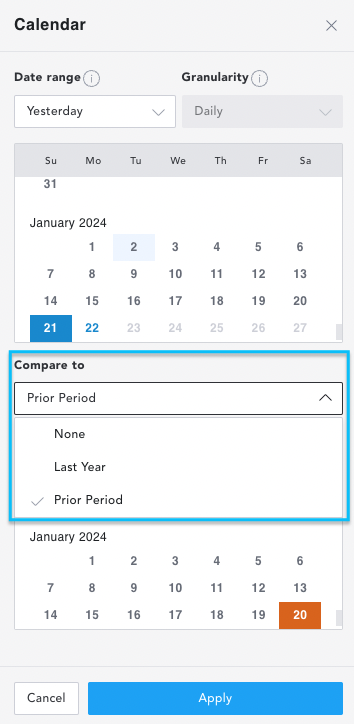
- Click on the date selector to bring up a Calendar filter panel. This allows you to select from a number of predefined date ranges or your own custom date range.

- Predefined date ranges are relative, i.e. they cover the days/weeks preceding but not including the current day/week. Custom ranges are fixed and can span up to 14 days or weeks.

- Next select your Granularity. Daily presents a data point for each day, while Weekly and Monthly aggregate the data into a single data point for each full week or month.

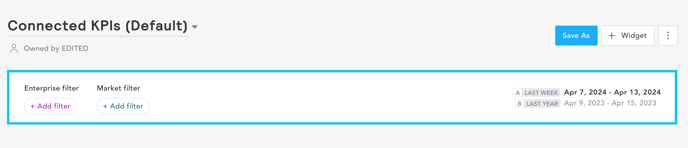
- Within the Calendar, you also have the option to Compare to a second time frame (B) by either selecting Prior Period or Last Year. For example, if your date range (A) is Last Week and you select to compare to Prior Period (B), the B period will relate to the preceding week. Selecting Last Year as a comparison period will analyze the same week the year prior.
- Ensure you click Apply to action your filters.
If your account has access to Market data only, the calendar will show weeks in Gregorian format (Sunday-Saturday). If your account has access to Enterprise only or both Market and Enterprise data, your calendar will be set up according to the Fiscal calendar provided by your business (Monday-Sunday).
Comparisons
The +Comparisons function will appear once Market Filters have been selected. This will allow you to decide which comparisons you’d like to make within your dashboard. For example, you could compare four retailers’ strategies and benchmark this against your own by selecting your brand as a baseline retailer, and then three comparison retailers.
- Click the + Comparisons filter pill.

- The filter panel will open on the right, allowing you to select the Retailers, Brands, Categories, Countries, Genders, Details, or Patterns you would like to compare and benchmark based on the filters you have set.
- Select the Baseline dropdown, in this example, we will select the Baseline retailer Zara.

- Select the Compare against dropdown to action the following.
- Select a number or all of the other retailers to benchmark Zara against by selecting the checkbox next to the retailer name e.g. Mango (UK).
- Select the checkbox next to All other retailer values to aggregate the data of all three retailers.
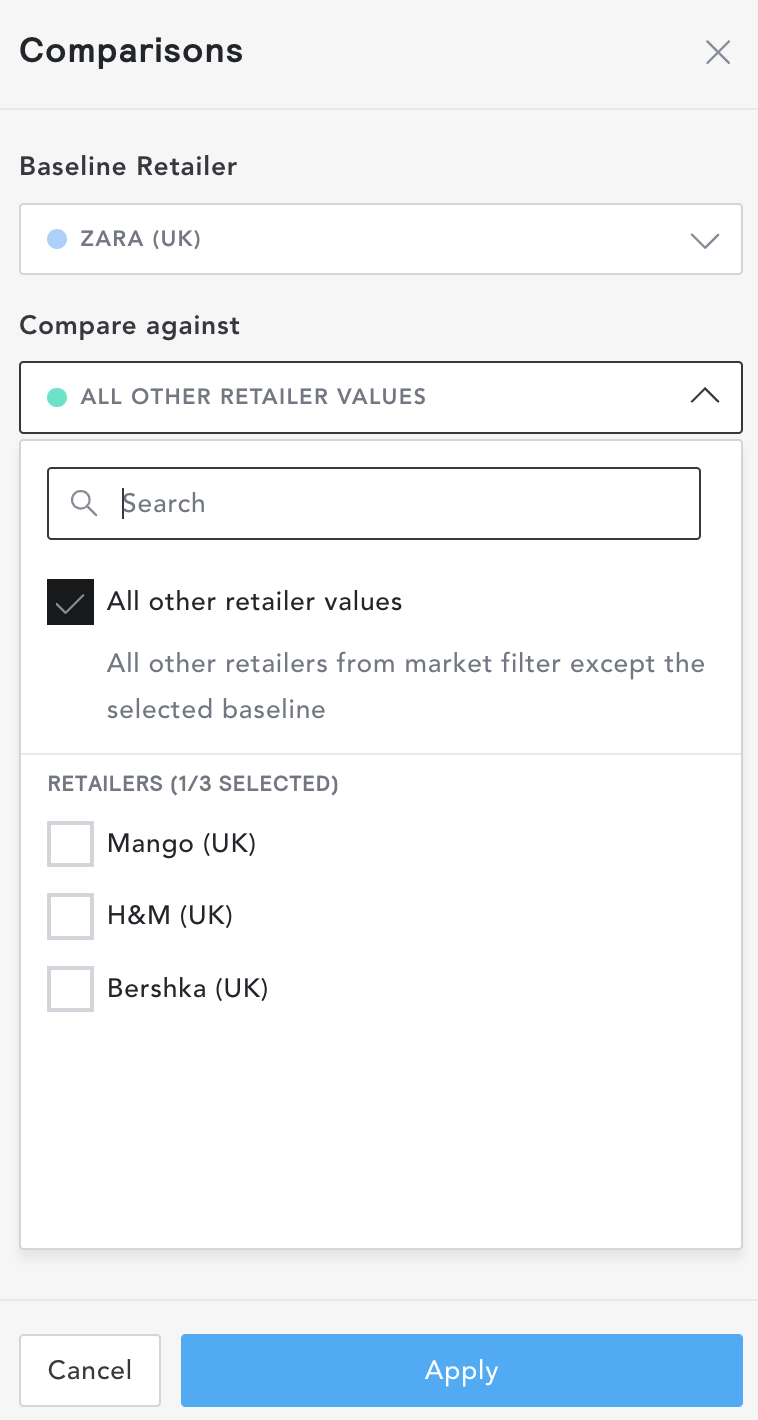
- Click Apply to save.
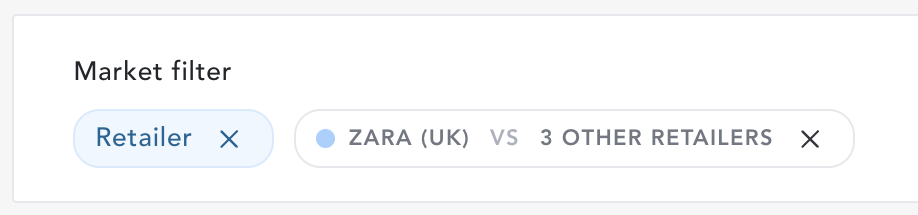
Once you have set this comparison, the pill will update at the top of your myEDITED Dashboard. See the example below, where Zara was set as the baseline retailer and compared against the three additional retailers: Mango, H&M, and Uniqlo.
See below for an example of how a widget would look with the 4-Way compare functionality.

Now you have set up your dashboard, it’s time to add some widgets so you can visualize your data. Read myEDITED: How Do I Add Dashboard Widgets?.
Your version of myEDITED may be Market only or Enterprise only rather than both. 'Market' refers to the data found within EDITED Market Analysis while 'Enterprise' are your own internal business metrics that are fed into EDITED Digital or Omni.
If one of these options is greyed out in your view, then your plan does not include both features. Please contact your account manager or email support@edited.com for more information.