You can easily perform seasonal strategy analysis within EDITED by building a workbook to view products that launched in the same season historically, and comparing your own seasonal launch strategy with that of your competitors.
Within your workbook, use the Date & Timeline filter to analyze products that launched new within the season/date frame you’d like to analyze.
Remember to remove the In Stock filter within Price & Status to make sure you are seeing all newness that launched in the selected time period, not just those that are still in stock today.
For instance, if we are focused on planning men’s winter coat launch strategy for Fall 2021, the filter panel may look something like this:
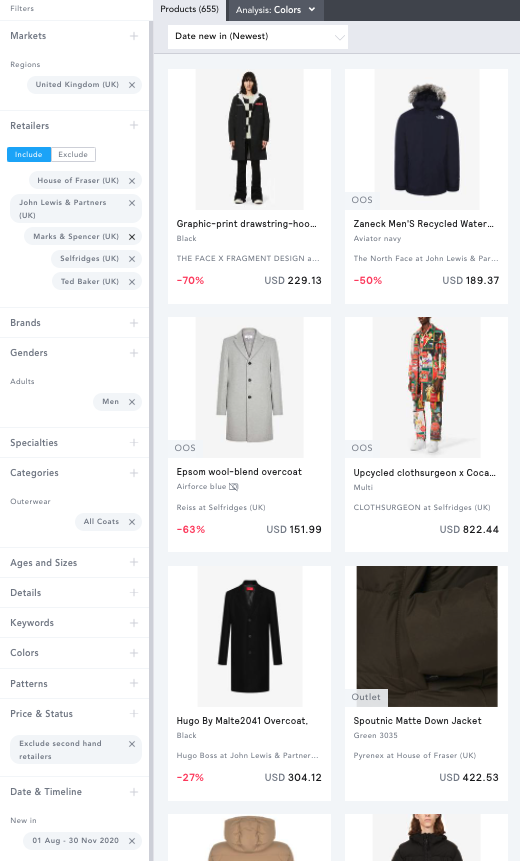
It’s important to note that you could also analyze a retailer's total product assortment that they had available at a specific time (not just new products), by selecting the In Stock filter within Date & Timeline, vs New In. Remember, you still need to remove your In Stock filter from Price & Status to ensure you’re seeing all products that were available at this time.
COLOR
The Color analysis tool can help you to spot color trends that were invested in last year and how much of an impact they made on the total assortment.
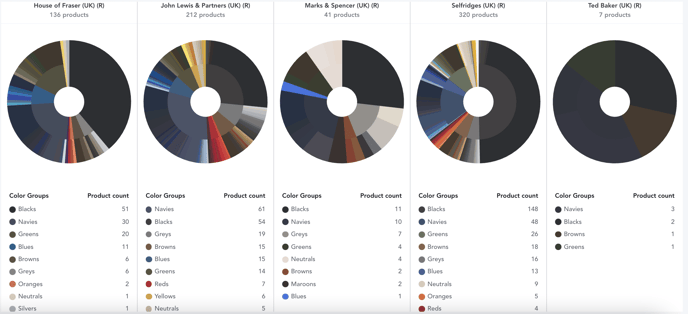
By looking at the color wheels across your own and your competitors’ assortments, you can spot a color that some retailers may have included last year that you might have missed out on and would like to consider including this season.
Toggling the chart to show numbers as Percentages can help you to easily identify the color mix across your competitors’ assortments. For example, you can track how much other retailers are investing in a trend color in comparison to their overall assortment. Although these trend colors may change season on season, this is a great way for you to understand what mix these retailers are attributing to these types of colors/trends, vs their total assortment
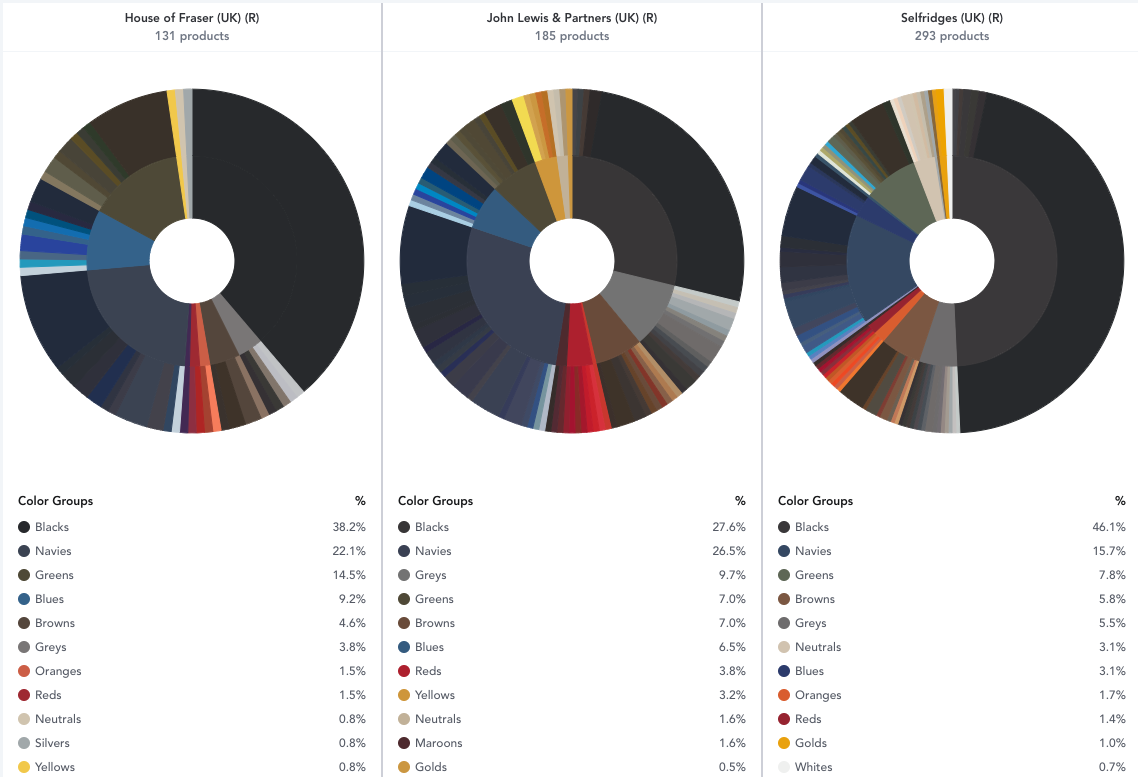
In the screenshot above we can see that John Lewis & Partners, House of Fraser, and Selfridges all decided to include trend-forward yellows and golds in their outerwear mix, with John Lewis & Partners investing more heavily in the trend, while House of Fraser and Selfridges allotted 1% or less of their assortment to this.
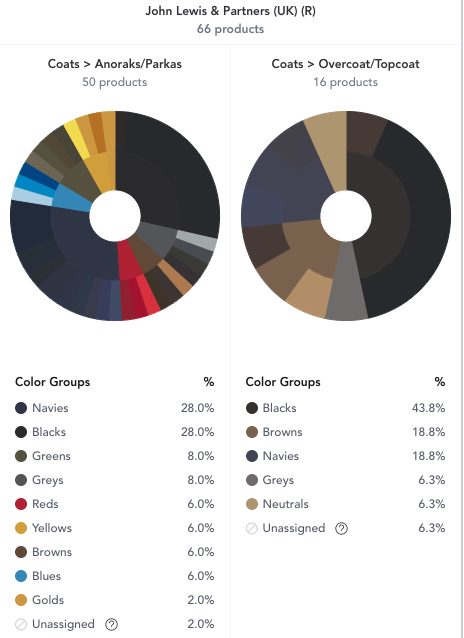
You can also break down categories further by utilizing the Group By and Split On functionality within your chart controls. Here you can see this retailer’s investment in the yellow outerwear trend was limited to anoraks and parkas, while they stuck to classic dark and neutral color families for overcoats and topcoats.
OPTIONS
Within the Options analysis tool, you can analyze the pricing spread across product assortments and plan how to adjust your seasonal pricing strategy.
Toggling the Price to Full within your in chart controls, you can analyze the highest selling price that retailers traded products in the previous season, giving insight into their planned pricing strategy.

Changing the view to Percentages will also allow you to see and compare the majority of assortment spread more easily.
NOTE: When exporting this chart, the data will export as counts. You can easily change this to percentages within your exported document by adding a formula column to the chart.
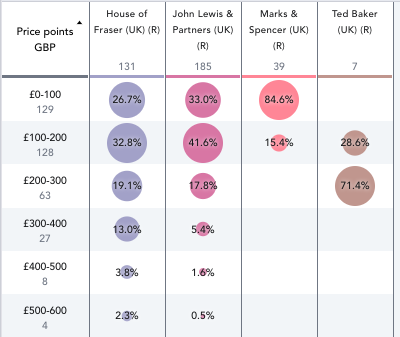
In the example above, looking at the previous year’s Full price, you might take note of the white space or lower percentage bubbles that you or other retailers in your market occupied, to identify price brackets that could be worth investing in.
Here, Marks & Spencer has concentrated over 80% of their coat assortment in the £0-100 price range, while House of Fraser, John Lewis & Partners, and Ted Baker have the bulk of their coats priced at or above £100. When planning pricing strategy for the upcoming season, Marks & Spencer may decide to price a few more products within the £100-200 bucket, both increasing margin opportunities and competitively closing the gap on pricing spread across the overall market.
You can customize the price ranges by breaking them down to smaller intervals for an even more granular look at where price adjustments may be most effective.
HISTORY
The History tool is extremely useful in planning phasing for seasonal launches - enabling you to easily analyze when your competitors launched their new season products previously.
Under the Show Activity dropdown, select New In to view the cadence with which the items in your workbook were released throughout the season. If other retailers are launching seasonal products earlier, you may decide to move up your launch timelines to enter the market at or before the same time to maximize sales potential.
Alternatively, analyzing the First Discounted chart, may indicate which products may have been less successful movers, or which weeks saw a struggle with sales and spurred markdowns.
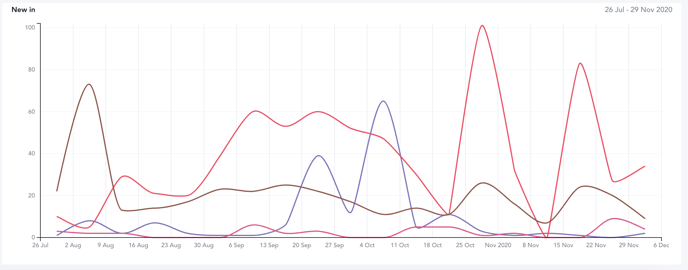
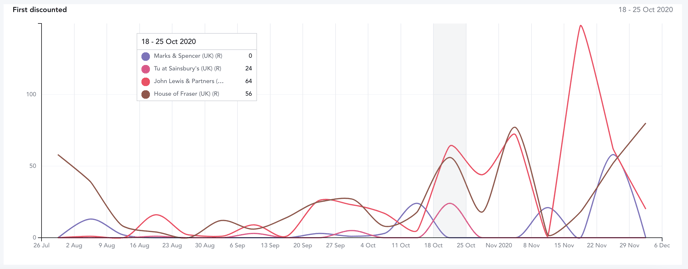
In the chart above, looking at the brown and red lines for House of Fraser and John Lewis & Partners respectively, both retailers increased instances of first discounting between mid-October and early November. This could indicate that their outerwear assortment needed a boost because it potentially launched too early and had been sitting too long, or that consumers had already purchased their outerwear by this month, leading to a drop in sales.