
This article explains how to use date range filters and comparisons in EDITED dashboards and historical charts to analyse trends over time, and gives practical steps and best practices to get consistent historical views.
Using date range filters in over-time/history charts
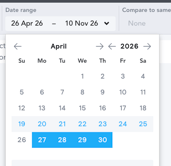
- Use the integrated date range control inside the over-time (history) chart to set the period you want to analyse (for example, last month, last 12 months, or a custom date range).
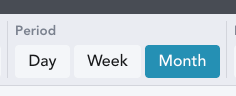
- For long-term views, switch the chart granularity to monthly to view data further back in time.
- Avoid applying separate date ranges in the left-hand Price & Status panel when using over-time/history charts — the built-in date range in the chart should be used instead, because external date filters can interfere with the historical chart data.
Comparing periods and past years
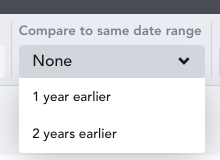
- Use the chart comparison feature to compare your selected date range to the same period 1 or 2 years earlier. This provides direct year-on-year context for trends such as discounts or assortment changes. You must be in chart view.
Best practices for tracking a consistent product pool across time
- Use the top filter labelled in/out of stock when working with historical data tabs to control which products are considered for each historical snapshot.
- To track the exact same set of products over time, filter your workbook to those specific products (for example by adding product IDs as keywords). This ensures the history tab displays metrics only for that selected product pool.
- Be aware that in-stock counts shown in the history chart reflect the chart’s integrated date settings and active filters; external or conflicting filters may change the counts.
Data coverage and granularity notes
- The platform holds daily data for up to two years. For dates beyond that range, use the history chart with monthly granularity to view aggregated historical trends.
Using keyword filters and grouping with date ranges
- Keyword filters search all product-card text (title, description, care) and can be used to include or exclude products (e.g., fabric keywords). Use exclusions to remove unwanted mixes (for example, exclude blends when isolating a single fabric).
- Within over-time charts you can group and split data (for example by style, retailer, or keyword) and view results by day, week or month. Toggle between absolute numbers and percentages to understand share vs. volume over your selected date range.
Practical step-by-step: set up a clean historical analysis
- Open the over-time/history chart you intend to use (e.g., Discount Over Time, Price Over Time).
- Use the chart’s integrated date range control (top of the chart) to select your analysis period.
- Set chart granularity (day/week/month) — use monthly for longer historical views.
- Remove or avoid using date filters in the left-hand Price & Status panel to prevent conflicts.
- Use the in/out of stock top filter to define whether the chart should consider products that were in stock on given dates.
- If you need to track the same products across the period, add those product IDs or explicit keywords to the workbook filters.
- Add grouping/splitting (e.g., by retailer, style, or keyword) to segment the trend and choose number vs. percentage display as needed.
- If comparing performance across years, enable the chart’s comparison option to compare the selected range with the same period 1 or 2 years earlier.
Troubleshooting common issues
- If historical counts or series look larger or different than expected:
- Check for active Price & Status date filters and disable them when using over-time charts.
- Confirm whether your workbook filters are selecting the intended product pool (use product IDs when you need an identical pool across time).
- Verify the chart’s date range and granularity (monthly aggregation will show different counts than daily snapshots).
- If a retailer or product does not appear in your analysis, confirm that the retailer is tracked by the platform and that your filters target the correct market/region.
Conclusion To analyse historical trends reliably, use the over-time chart’s built-in date range and granularity controls, avoid conflicting external date filters, and define the product pool explicitly (using in/out of stock and product ID or keyword filters) when you need to track the same items across time. Use the chart comparison feature to add year-on-year context for clearer trend interpretation.