-2.png?height=120&name=EDITED%20Logo%20Dark%20-%20Color%20(1)-2.png)
Weekly exception reporting
Opportunity Overview
The Opportunity Overview summarizes your opportunities by 8 main product pillars.

- Conversion – Identify high & low converting products and products not selling. Consider actions to accelerate sales and ensure no demand is left unfulfilled.
- Selling – Identify selling and not selling products. Consider action to adjust exposure or accelerate sales.
- Inventory – Identify over/understocked products compared to their peers. Consider actions that will accelerate sales, mitigate inventory risk and avoid wasting demand.
- Profit – Identify high, low and negative profit producing products. Consider actions that capitalize on winners and minimize losses.
- Views – Identify high & low viewed products and products not viewed. Consider actions that increase, decrease or redirect exposure.
- Price – Identify high and low margin products that might warrant a price change given conversion, competition, consistency, profitable or other.
- Returns & Cancellations – Identify products with a high rate of return or cancellation. Consider merchandising & operational actions to mitigate lost sales.
- Marketing – Identify products with high or low external views. Consider these signals when planning marketing strategy.
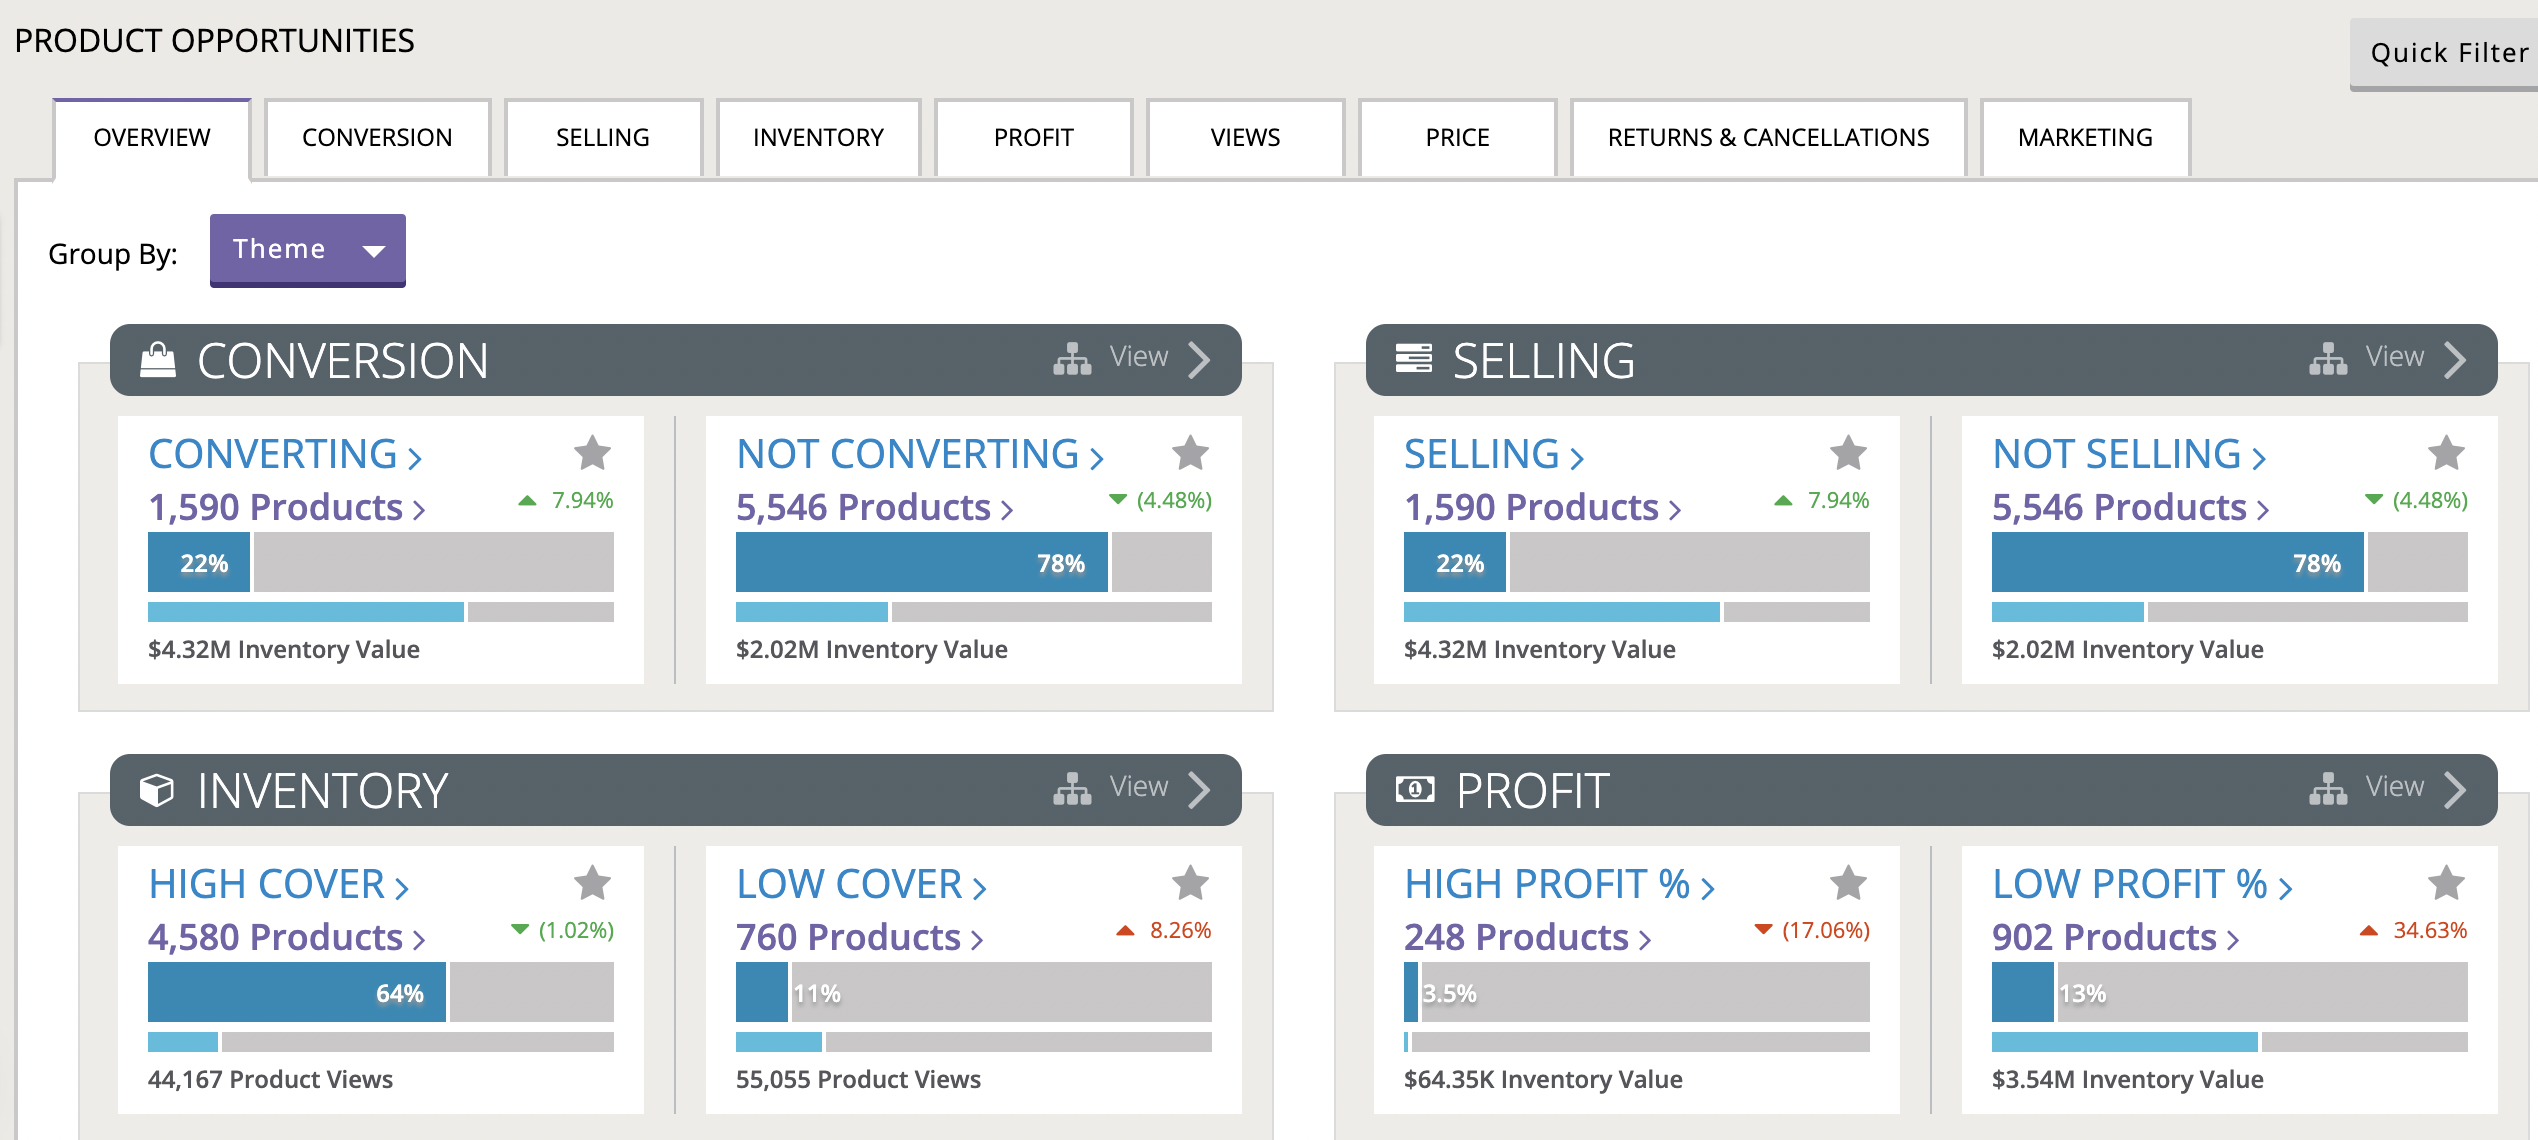
The Overview screen allows you to understand how each pillar impacts business. For instance, how many products are selling versus not selling? How much inventory do those products represent? By using the drop down boxes, you can switch between the default metric and several other key overview metrics within each area. You may click any of the tabs or the “View” link from the Overview tiles to navigate to an Opportunity Tree. You also may click directly into the high-level node (such as “Selling”) to go directly to a node overview screen for that topic.
Opportunity Trees by Action
When viewing an opportunity tree overview page, the default view presents tiles by Theme. Yet,

you now have the ability to toggle and view by Topic (which is what is displayed on the Hubs) and by Action which is a new view that summarizes the Action candidates identified within the trees. For example, it will mine all of the products identified in the opportunity tree and pull out all products for which “Increase Exposure” has been identified as an Action candidate.
Upon clicking into an Action tile, you will receive a list of items matching that action. You also have an opportunity to click the “View Product Health” checkbox to provide visual clues as to where the product sits among its peer group for particular metrics. In this example, it is clear that increase exposure is a plausible action given that these products have relatively high profit/view, low product views and high product conversion.
Quick Filters
If you own a particular area of the business or have a specific use case in mind, you can also apply quick filters at any point to narrow your view to a smaller set of products. Quick filters work similarly to global filters except that they allow you to filter on metrics and attributes as well, but limit your perspective to product and site level filters.
Node Overview
Once you click into a node, you are presented with an overview page offering several different views of the node.
- Summarizes the overall value you saw on the opportunity screen in the same way as on the overview screen. Use the drop down box to change metrics as needed.
- Gives you additional insight about the list including one or more action candidates to consider for the items in the list.
- Is a thumbnail preview of the top items in the list. Note that the sorting metric is tied to the drop down box in the summary area (area 1 in the image below). Clicking an item image will take you directly to the detail page for that item.
- Is a tree map to help you to identify any big themes in the list. You may use the drop down boxes to change what field is mapped (category by default, but attributes are also available if configured), what metric dictates the box size, and what metric dictates the depth of color.
- If sub-nodes are available, you will also see an option to dig deeper and navigate into sub-opportunities. In this example, clicking on the “Low Views” link would take you to a node overview featuring “Selling” products that convert at a high rate, but receive low views when compared to their product peers.
Opportunity Grid
When you are ready to analyze the specific products within the Opportunity list, you may click the Products tab. The Products tab will look familiar to legacy Opportunity lists with a few notable exceptions:
- Via this grid, you may click the wrench icon and select any applicable Product metric (you aren’t limited to the original list that DynamicAction defined).
- You may apply Quick filters on this page (as well as the prior pages) to help narrow your view. For example, you might want to filter to only Adidas products within the Bags category. Via these filters, you may also filter on Product Attributes.
- You may leverage the Display By area to roll-up the Product list. For example, you might want to roll it up by Brand or Category or Price Status or Attribute to identify any higher level themes.
- If you would like a more visual view of the list, you may toggle to the Image Tile view.
- You may drill down on any product to arrive at the Item Detail Page.
- You have the option to view the product health percentiles on all of the opportunity grid pages.
Bookmarks, Downloads & Email
Like legacy Opportunities, the new opportunity grid pages support your ability to bookmark a specific view, download the list, distribute it via a one-time email or distribute it via a scheduled/recurring email. See Section 5.2 of this document for more information on the Toolbar.
Opportunity Image Tiles
If you prefer to analyze the opportunity in a more visual fashion, you may click the image icon (near the top of the tab, to the left of the Action Candidates) to display the opportunity in the form of image tiles. The image tiles mirror the list on the grid page and showcase the grid’s first two metrics by default, but you may edit those quickly using the drop down boxes in the upper right of the tab. If the metric you want to use is not available in the drop down boxes, you will find all available metrics at your disposal by clicking the wrench icon.
 Opportunity Definition
When viewing any opportunity list or node overview, you will find an information icon in the breadcrumb at the top of the page. On click or hover, you will be presented with a description box that reveals the filters used to define the list. In this example, to be considered “Overstocked,” the product must be among the top 30 percentile in stock cover with respect to its category peers. In other words, it must have stock cover higher than 70 percent of other products in its category (or potentially parent category if too few products in its immediate category). To qualify as Low Views, the product must fall within the bottom 30 percentile for Product Views or must receive fewer than 50 product views during the analysis period. To qualify as “No Recent Views,” the products must not have any views over the last 4 weeks.
Item Detail Page
From the Opportunity Grid or Image Tiles, you may click into a specific item to go even deeper. At the top of this page (1), you will find an image thumbnail, the product’s metadata (including each of its attributes), and a trend chart (2) allowing you to trend any 2 product metrics. Use the drop down menus at the top of the chart to change metrics and time frames. In the Product Health section (3), you learn how this product ranks against its peers across key metrics. Does it get relatively high views? Does it have too much stock? Does it convert well? Does it generate profit? Etc. Default values are chosen, but you may choose different health metrics by clicking the gear in the upper right area of this section. In the Action Candidates section (4), you learn how you can improve those key health metrics. The section summarizes the action candidates found across all opportunity lists in which the product sits. To help you gauge whether or not an action is worth taking, use the drop down box at the top right of the section to toggle between estimated profit and revenue value associated with improving the metric by a practical amount relative to its peers. You may also click on the action candidate (such as Test Checkout in the image below) to view the specific nodes the product fell in (4A) to suggest these action candidates. To see other products in the node, you may navigate to the node overview for an opportunity by clicking the specific opportunity (such as “Low Profit %” below).