Six chart types help visualize the data in each widget. Each widget card outlines its chart type at the bottom left.

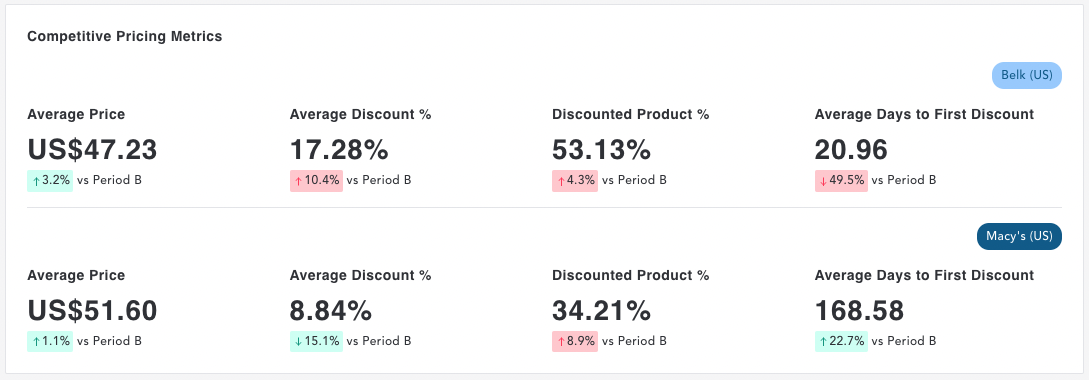
Metric Tile
This widget allows you to select up to eight metrics to quickly view and understand key data points.
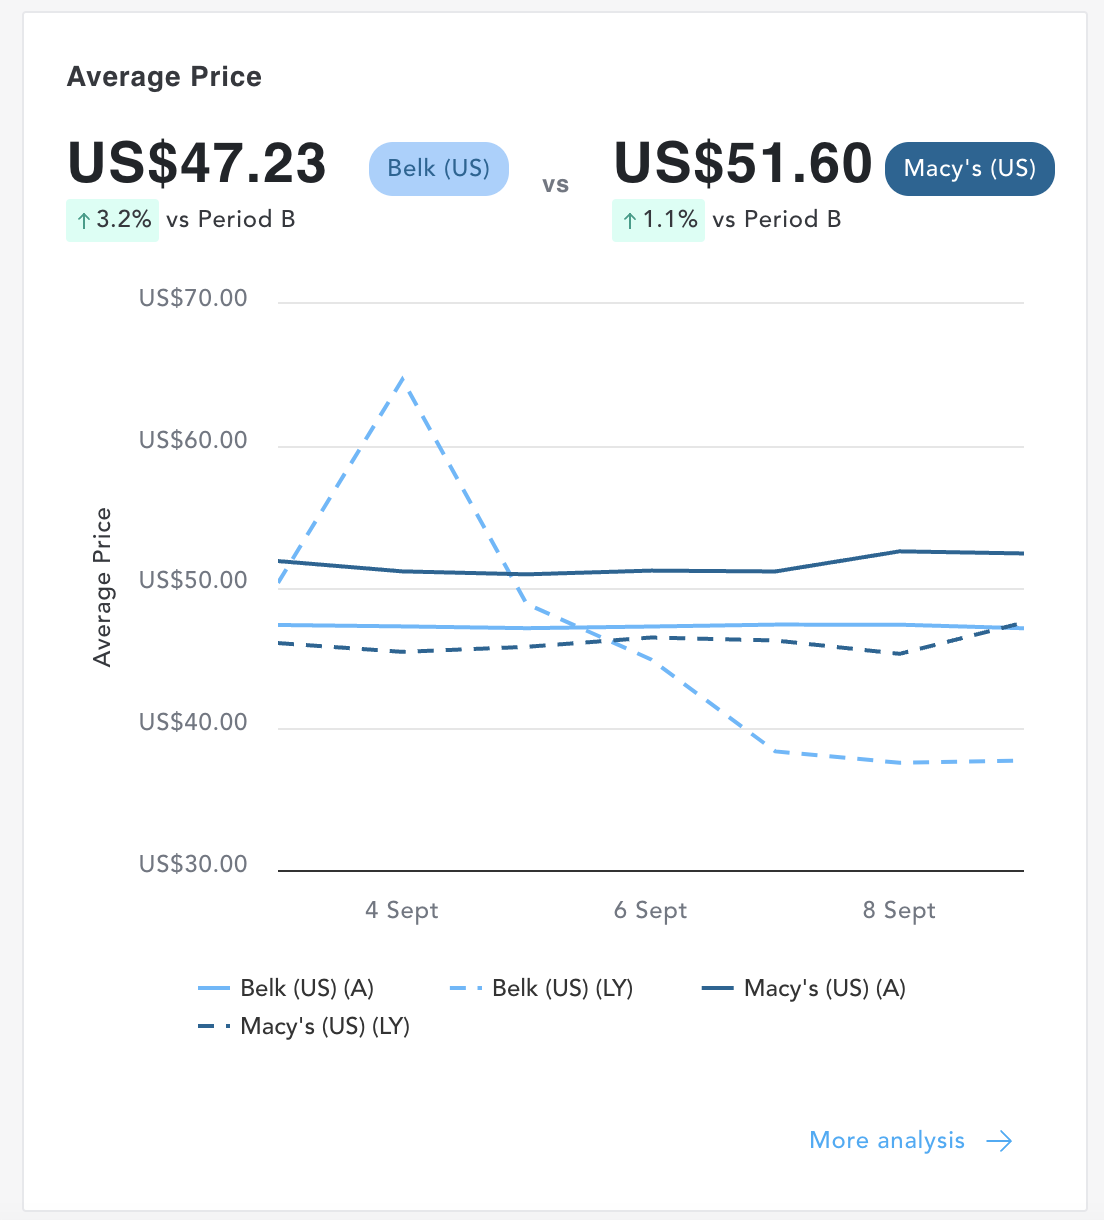
Metric Trend
This widget allows you to analyze the movement of the selected metric over time.
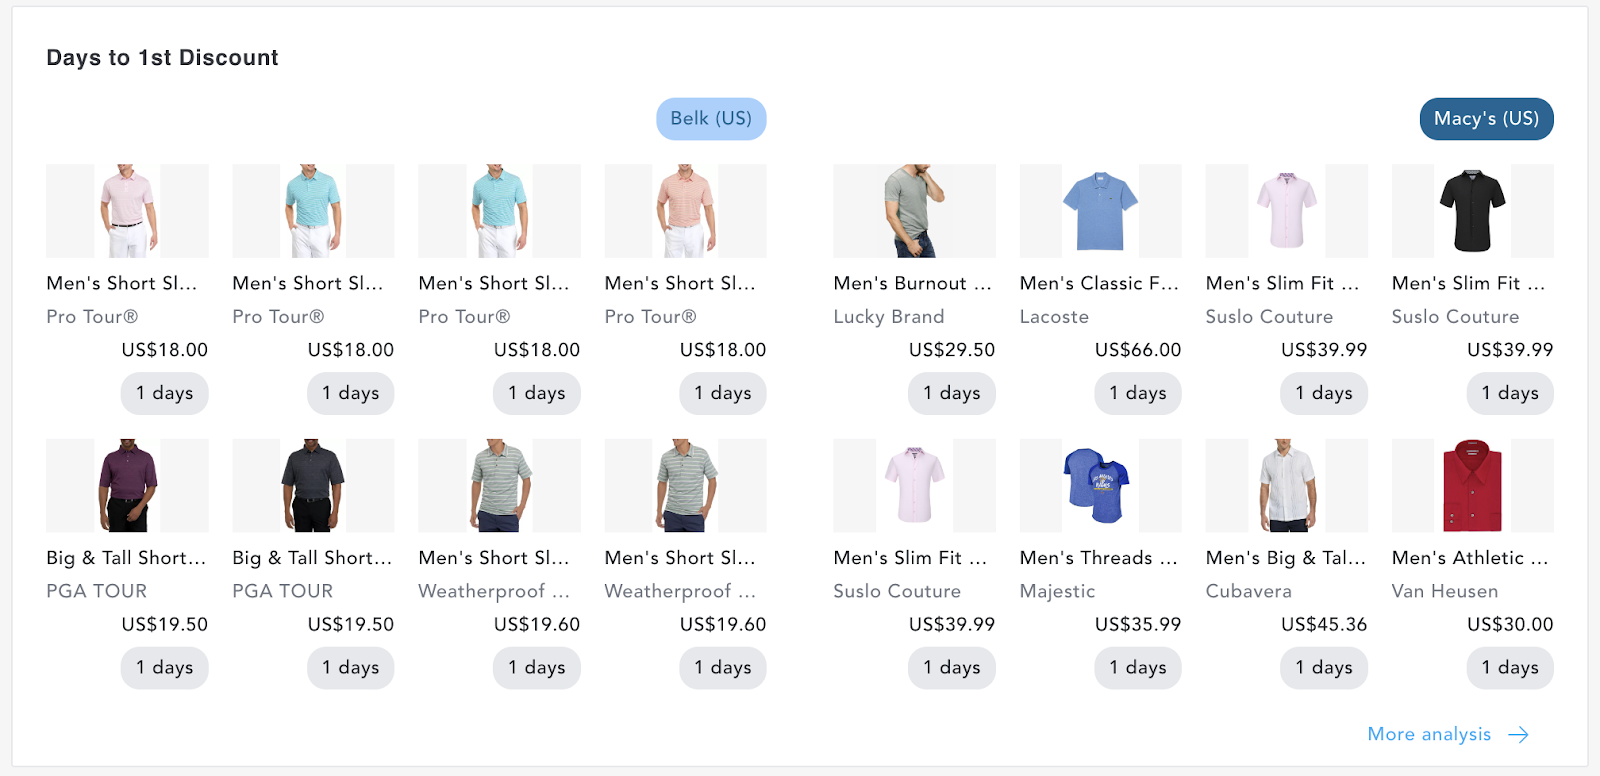
Product Card
This widget displays product image cards sorted by the selected metric.
Table
Table widgets analyze product fields sorted by metrics. This widget functions slightly differently depending on the data you are analyzing.

Bubble Chart
- These widgets look at the relationship between three metrics.
- Each bubble represents a single data point with the variables indicated by horizontal position, vertical position and dot size.
- These widgets cannot be customized.
- Bubble Chart widgets are for Pricing and Site Merchandising Enterprise clients only.

Opportunities
- These widgets compare products with their peers at their lowest category level to identify opportunities in pricing and exposure.
- These widgets cannot be customized.
- Opportunity widgets are for Pricing and Site Merchandising Enterprise clients only.

Section Header
Use the Section Header widget to organize your dashboard into clear sections.

You can also add a description underneath the section header.

Your version of myEDITED may be Market only and not include Enterprise data. Market data is competitor data that EDITED collects from third-party retailers' websites, while Enterprise refers to your internal business metrics.
Please contact your account manager or email support@edited.com for more information on upgrading to Enterprise.