- Help Center
- How To Use myEDITED
- Dashboards
-
How To Use myEDITED
-
How To Use EDITED Market
- Getting Started With Competitive Market
- Building & Managing Competitive Market Workbooks
- Using Competitive Market Workbook Filters
- Competitive Market Workbook Advanced Filtering
- Competitive Market Analysis Types: Analyzing Products In Workbooks
- Competitive Market Analysis In Practice
- Classic Competitive Market Dashboards
- Lists
- How Does EDITED Competitive Market Work?
- Sharing EDITED Data
- Market: Understanding Terminology & Methodology
- EDITED Support
- Frequently Asked Questions
-
How To Use EDITED Digital & Omni
- Getting Started: Navigation & Administration
- Getting Started: Control Panel
- Analysis Types: Dashboards
- Analysis Types: Insights
- Analysis Types: Opportunities (Decision Trees)
- Analysis Types: Opportunities (Action Impact)
- Analysis: Opportunities (Product Badges)
- Analysis Types: Basket Analysis
- Analysis Types: Tasks
- Getting Started: Using Charts
- Getting Started: Exporting, Sharing, Saving & Downloading
- EDITED Digital/Omni FAQ
- EDITED Digital/Omni Data Sources
- DynamicAction Glossary
- Release Notes Archive
- Additional Administration
-
How To Use EDITED Research
-
How To Use EDITED Messaging
-
How To Use EDITED Overlay
-
How To Use EDITED Signal
-
How To Use EDITED Match
-
Webinars
myEDITED: How Do I Use Dashboard AI Summary?
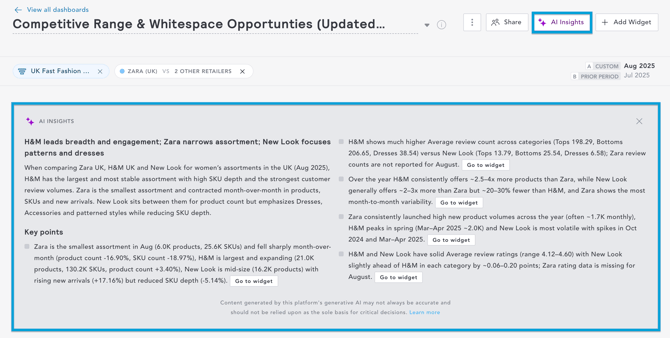
Once you have created a myEDITED dashboard, click the Insights button at the top right of your dashboard.
A panel will populate at the side of your dashboard, containing Insights in the form of descriptive paragraphs.
Depending on the number of widgets in your dashboard, you may need to scroll the Insights panel to view the full summary.
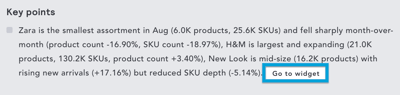
To see the widget referenced within the Insights, click Go to widget at the end of each Key point. This will take you directly to the most relevant widget per point.
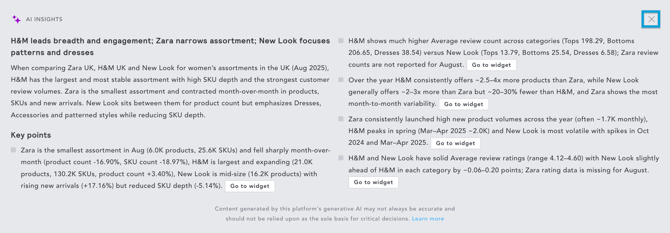
To close the Insights panel, click either the X at the top right of the panel or the Close button.
Dashboards AI Summary is currently only available for Market widgets with a maximum of two comparisons within a dashboard.
This is because Market widgets use public data, which EDITED runs through a third-party LLM.
The insights also do not cover Product Card Widgets.
AI Summary Tutorial
Review how to leverage the AI Summary feature in the interactive tutorial below.
9 STEPS
1. This tutorial will teach you how to leverage the AI Summary feature.
Before clicking insights, ensure your filters are set or have been reviewed within your dashboard.
2. Click Insights.
3. This will activate a panel on the right-hand side of your dashboard containing a summary of insights.
4. Click Go to widget to be taken to the most relevant widget per key point.
5. Once you have analyzed all of the insights, click Close.
6. To share these insights with colleagues, ensure your Insights panel is open.
7. Click Insights.
8. Click the three-dot menu button to share these insights.
9. Click Print to PDF. This will allow you to attach the PDF to any emails you are sending across the business.
You have now completed the tutorial.
Here's an interactive tutorial
** Best experienced in Full Screen (click the icon in the top right corner before you begin) **https://www.iorad.com/player/2398535/Dashboards---AI-Summary-Insights
The content generated by EDITED's Large Language Models (LLMs) is for informational use only. EDITED disclaims liability for its accuracy or reliability and advises against making decisions based solely on these summaries. Use at your own risk.