Navigate to Charts via the dropdown at the top right-hand corner of the top panel when you're in:
- Dimensional Insights
- Product Opportunities Lists
- Basket Reports
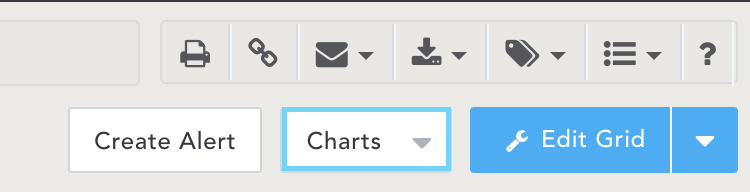
Click on the Charts dropdown.
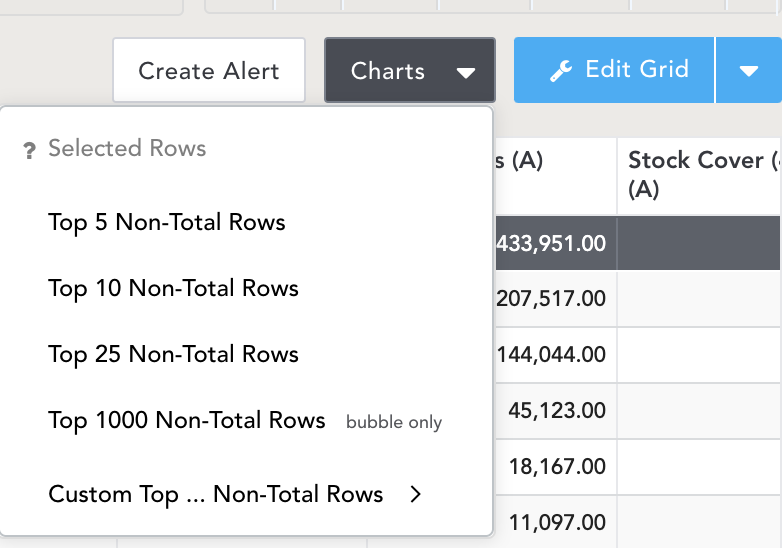
The drop-down will give five different options to select from.
- Non-Total Rows: the number of rows from a report
- Custom Row: select specific rows from a report
Note: for 1000+, the chart will be shown as a ‘bubble’ chart.
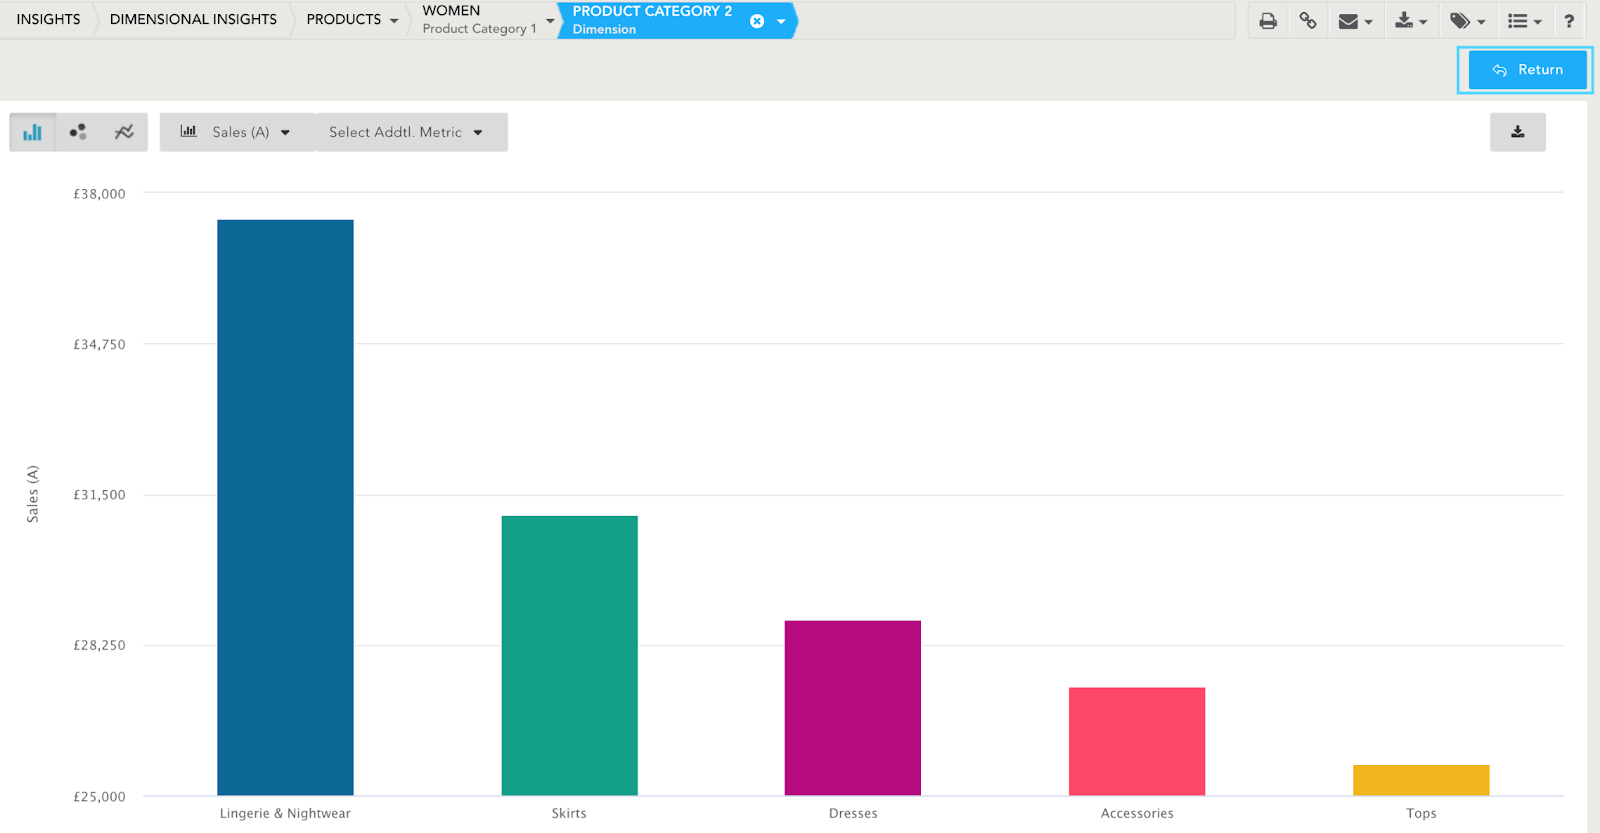
To return to a report, click the Return button in the top right-hand corner.