-2.png?height=120&name=EDITED%20Logo%20Dark%20-%20Color%20(1)-2.png)
Metrics Overview
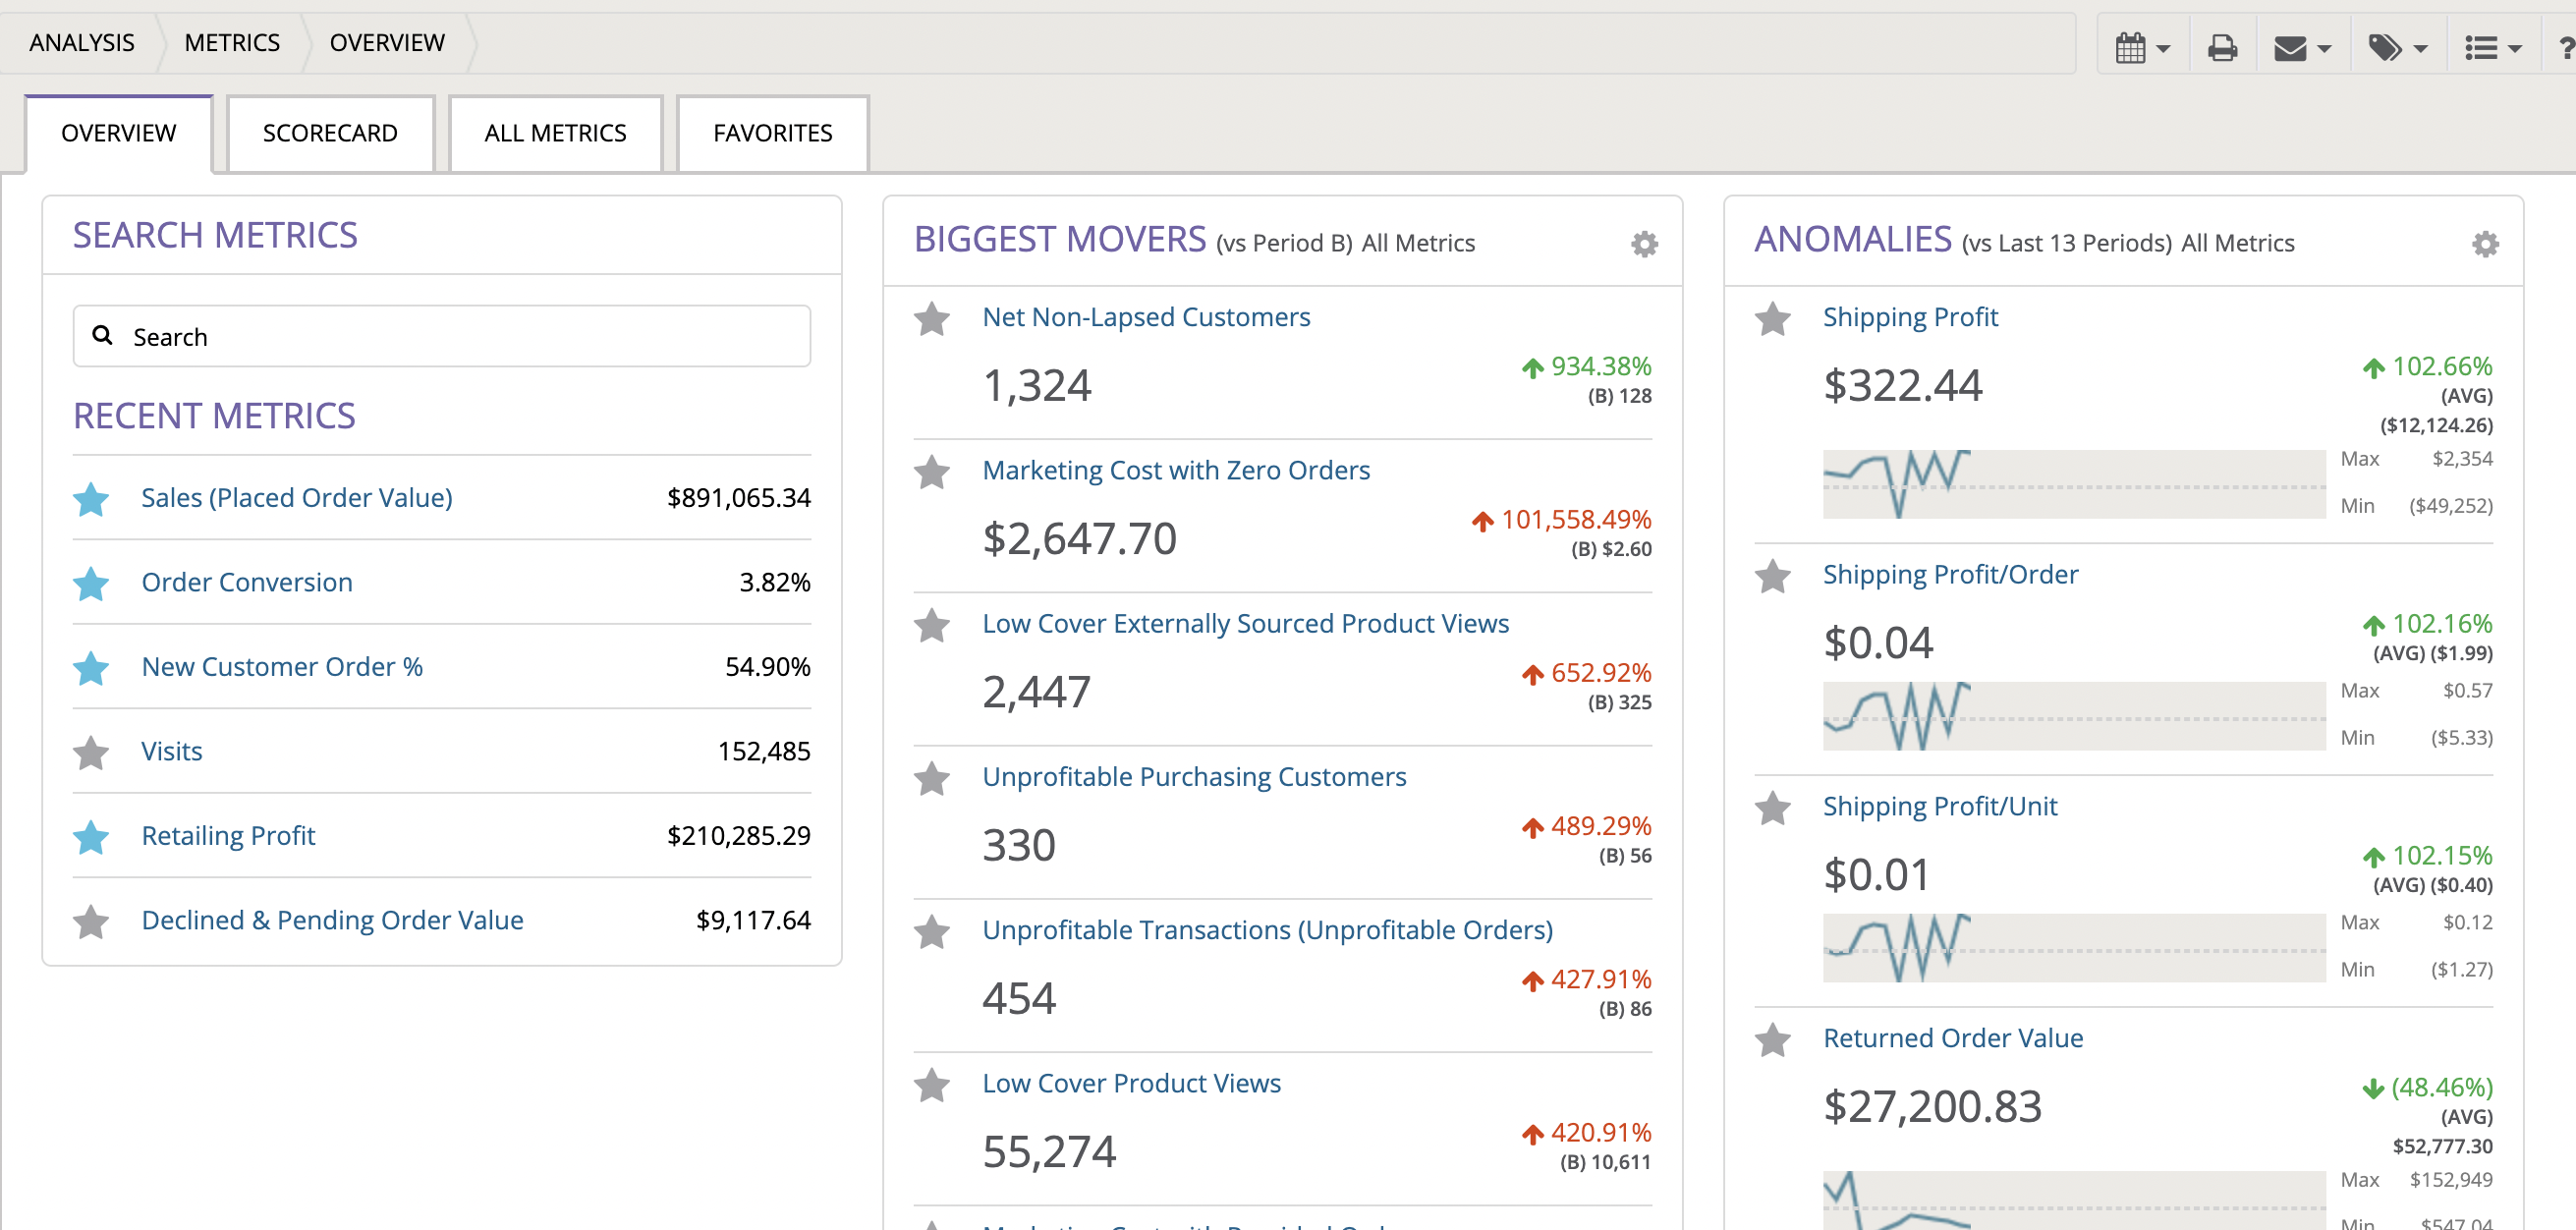
The Metric Overview page is intended to help you quickly find a desired metric and to alert you to the metrics that might require attention.
In the Search Metrics module, you may type in your metric of interest. As you type, matching metrics will be presented. On selection, you will navigate to the Metric Detail page to gain an in depth analysis of the metric.
The Recent Metrics module presents your most recently viewed metrics. DynamicAction will seed the list with a few default metrics if you are a new user.
The Biggest Movers module identifies the top 8 metric movers as compared to Period B measured by absolute percentage change. It then groups the metrics to show positive movement first and negative movement second. It is possible, however, that all 8 top movers are either positive or negative. If you would like to narrow this module’s consideration set, click the setting icon in the top right of the module. This selection will limit which metrics are considered.
The Anomalies module identifies the top 5 metric movers as compared to the average of the last 13 Periods. It excludes any metrics already surfaced in the Biggest Movers module. The dotted line in the chart represents the 13 Period Average. The Minimum and Maximum values in that period are also identified. If you would like to narrow this module’s consideration set, click the settings icon in the top right of the module. This selection will limit which metrics are considered.
On Hover, you will be presented with Quick View and Metric Detail buttons. The Quick View is useful if you want to quickly understand high level trends and drivers or if you want to toggle quickly between multiple metrics. The Metric Detail view is useful to gain an in-depth look of metric performance, drivers, distributions and opportunities.