-2.png?height=120&name=EDITED%20Logo%20Dark%20-%20Color%20(1)-2.png)
Metric Drivers
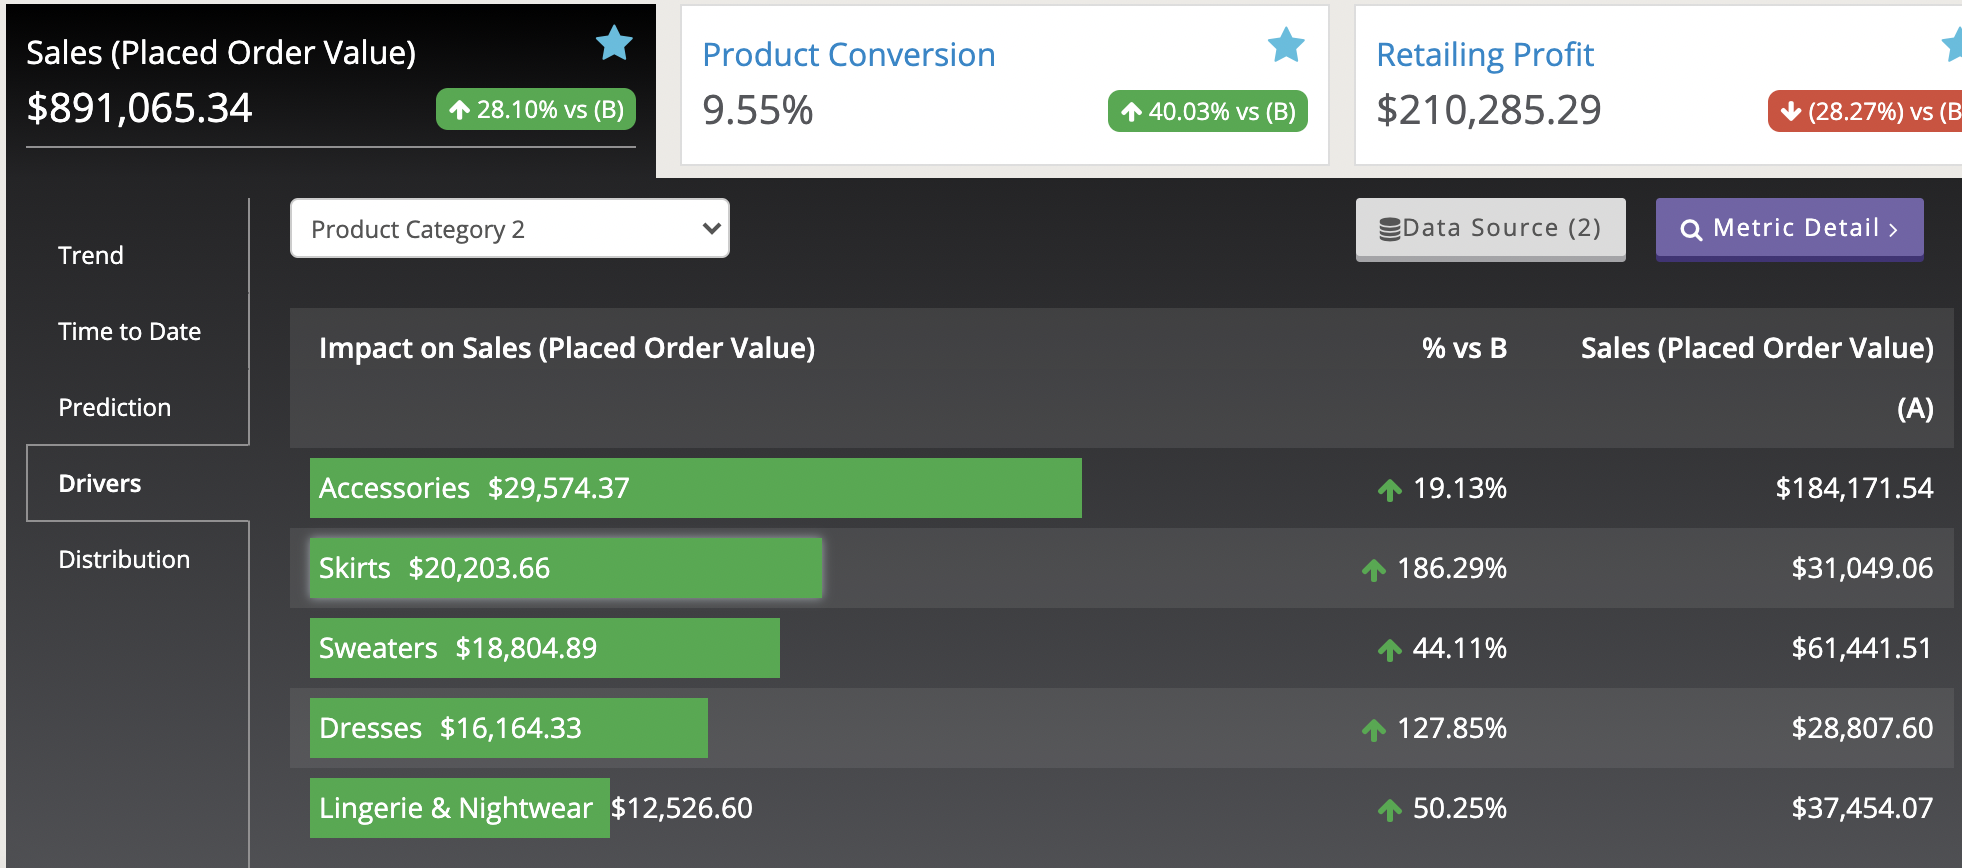
Metric Drivers provides an overview of what had an impact on a metric’s change from Period B to Period A. DynamicAction analyzes this impact across dimensions including: Product Category, Brand, Customer Segment, Marketing Channel, Page Category, Site/Channel and Ship Region. *Note: not all dimensions are applicable for each metric.
To determine impact, DynamicAction considers the change in the metric from Period B to Period A. For example, if Product Conversion goes from 3% to 3.5%, it determines what drove the 0.5% change. The impact analysis considers absolute impact as well as its weighting. For example, Gucci may have converted extremely well, but may not have had the highest impact because you sold very few Gucci products.
Metric Drivers Drill Down
On the drill down views, you will find a bridge chart. Drill down views are accessible from Hubs, Metric Overlays and Metric Detail screens. The bridge chart represents the values in the data table. It illustrates how the metric changed from period B to A by showing the 10 largest positive and negative drivers impacting the metric change and an “Other” bar to represent the difference.
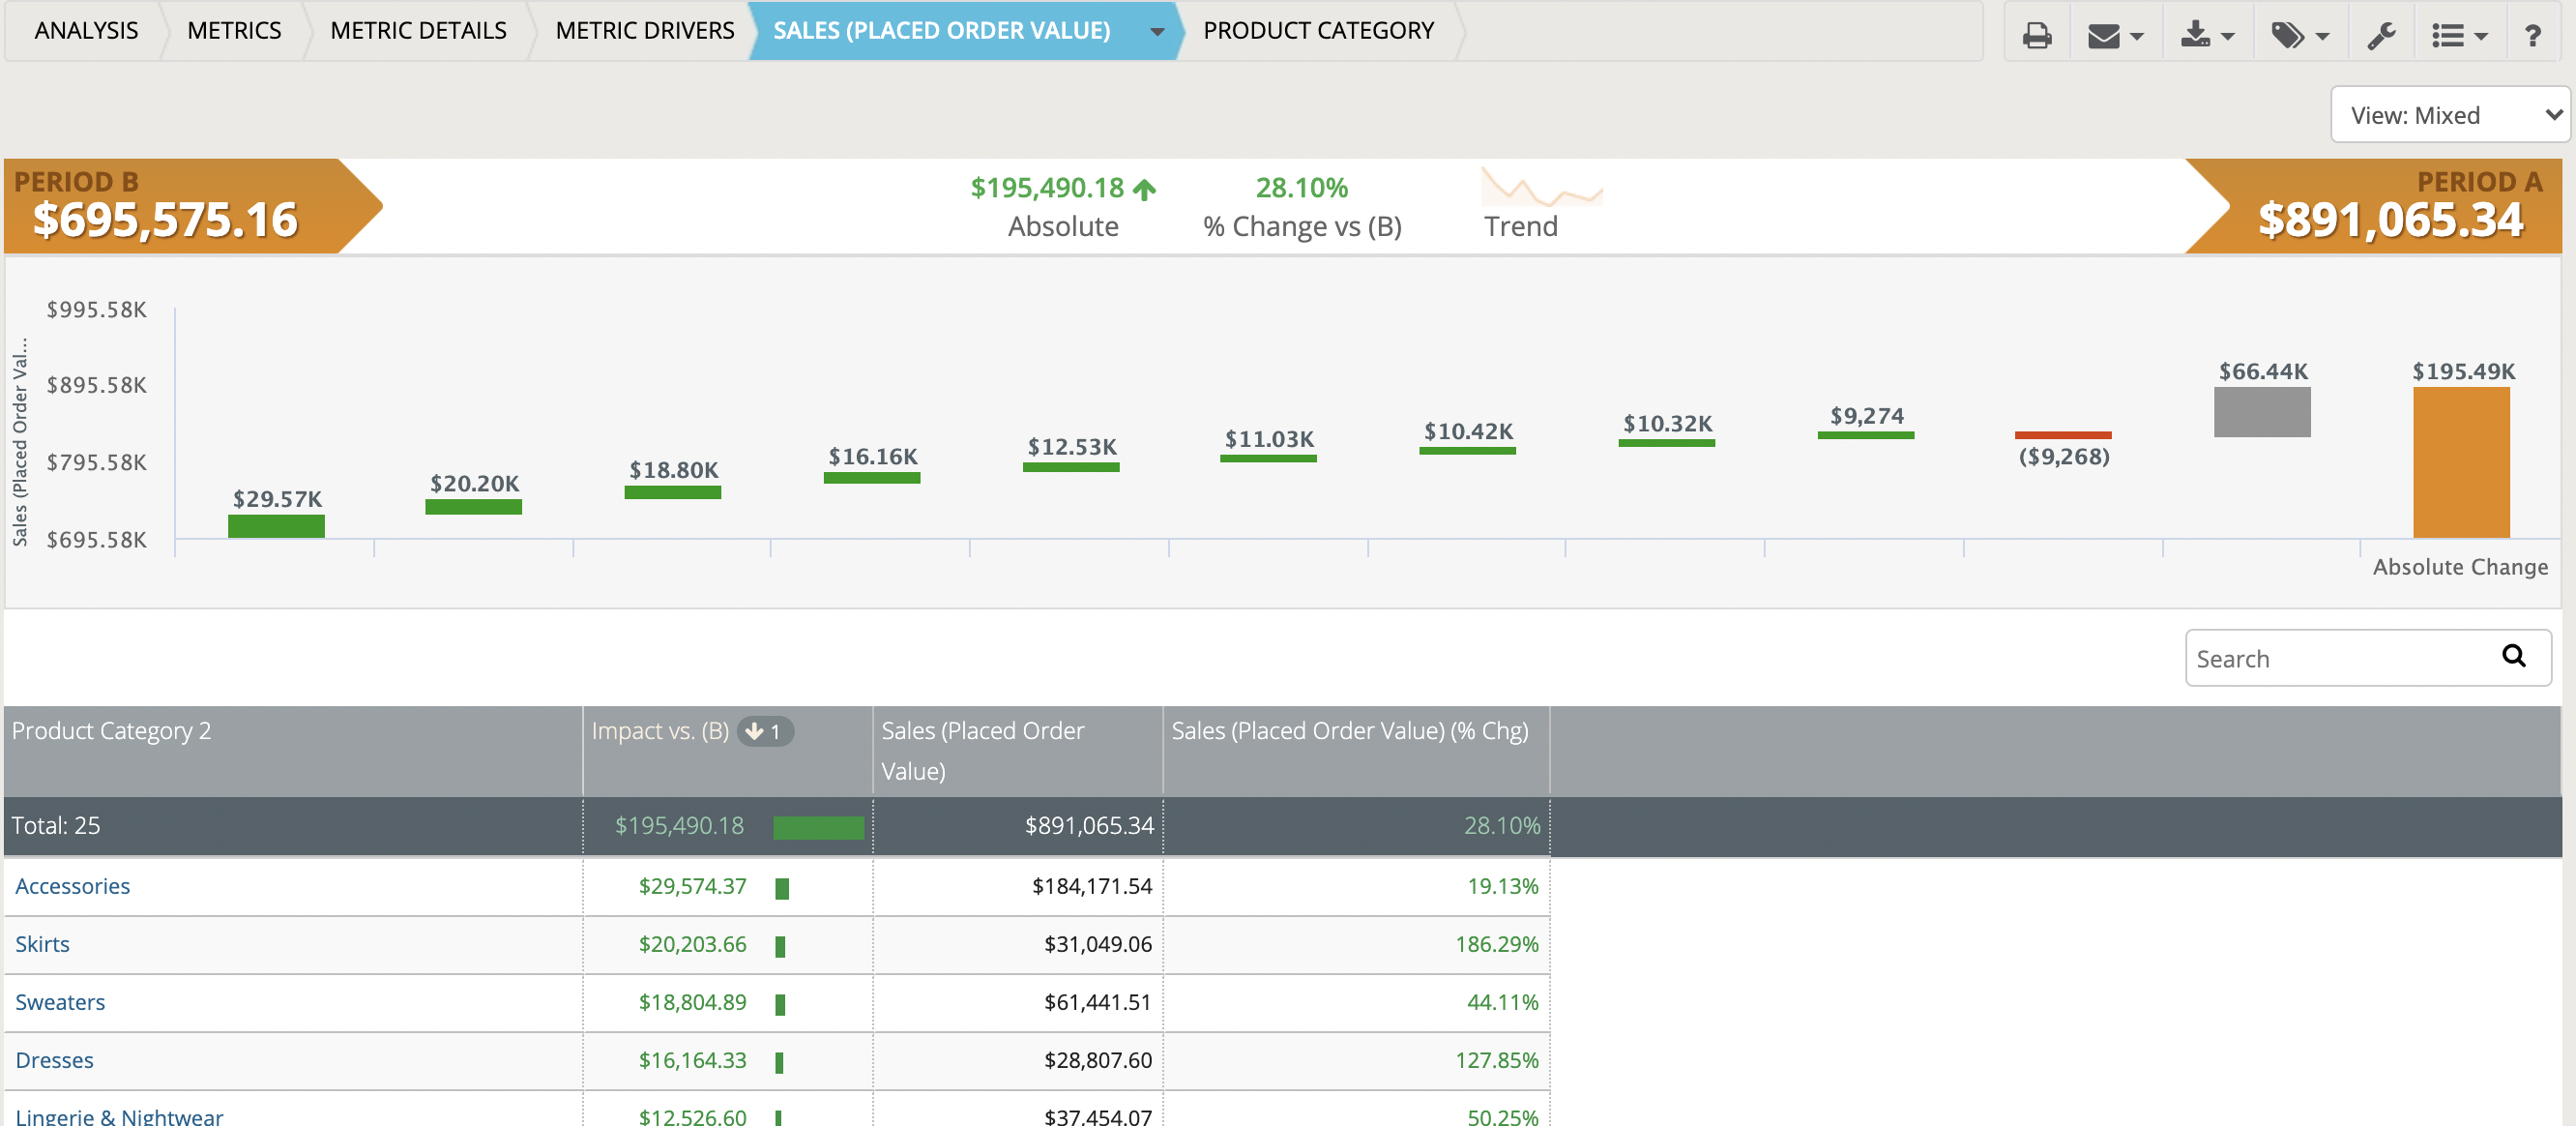
Beyond the impact value, in the data table you will find a “weight” metric for any ratio metric. It is typically the denominator. For example, the weight metric in Page Views/Visit is Visits. The weight metric in Average Order Value is Orders and so on. The weight is part of the impact calculation because an item in the list may have moved a great deal, but if it had very few visits (or orders or whatever the weight metric), then it still likely had little overall impact. In the example above, Affiliate moved more (higher % change) than Direct, but Direct still had more impact because it generated roughly 19 times more Visits than the Affiliate channel.