-2.png?height=120&name=EDITED%20Logo%20Dark%20-%20Color%20(1)-2.png)
Metric Details
The Metric Details page offers a one-stop destination to digest all there is to know about your desired metric. You can navigate to it via the “Metric Detail” buttons on the hubs and Metric Overlay, by clicking into a metric from virtually any screen, or by navigating to it via the left navigation menu.
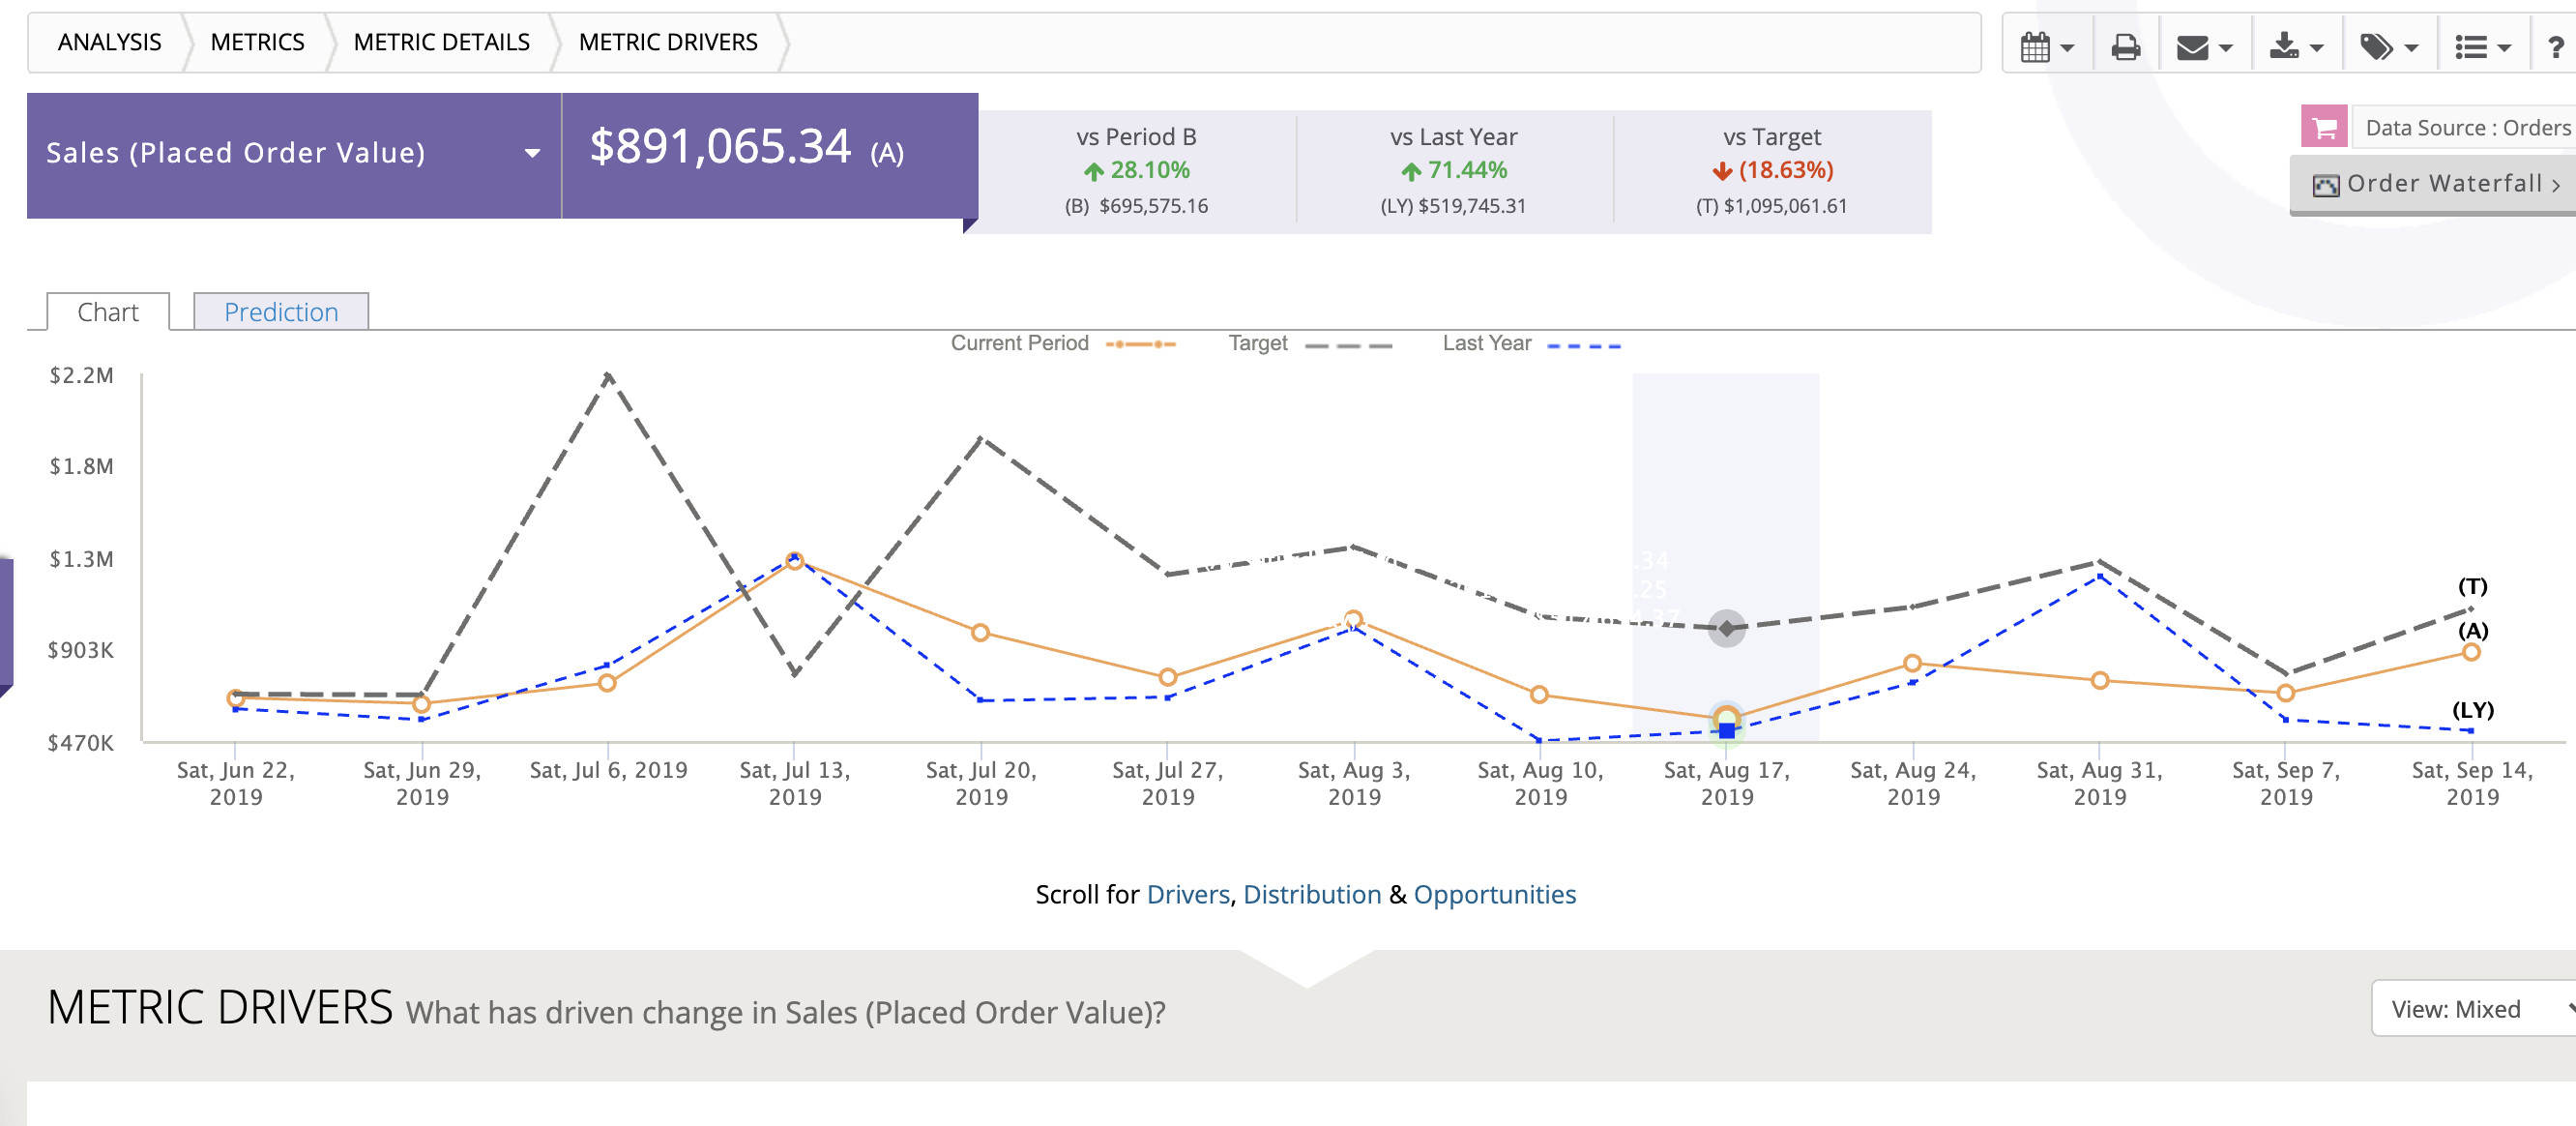
At the top of the page, you will find a trend chart plotting the last 13 time periods. If you have selected “Last Year” and/or “Target” in the calendar, the values will appear in the ribbon and the lines will appear on the trend chart.

The Metric Prediction feature leverages historical data to train a predictive model that can help forecast future metric trends. The more history, the more accurate the model. The algorithm is based on an additive model where non-linear trends are fit with yearly and weekly seasonality, plus holidays. The predictions can quickly help you to validate if you are on or off course.
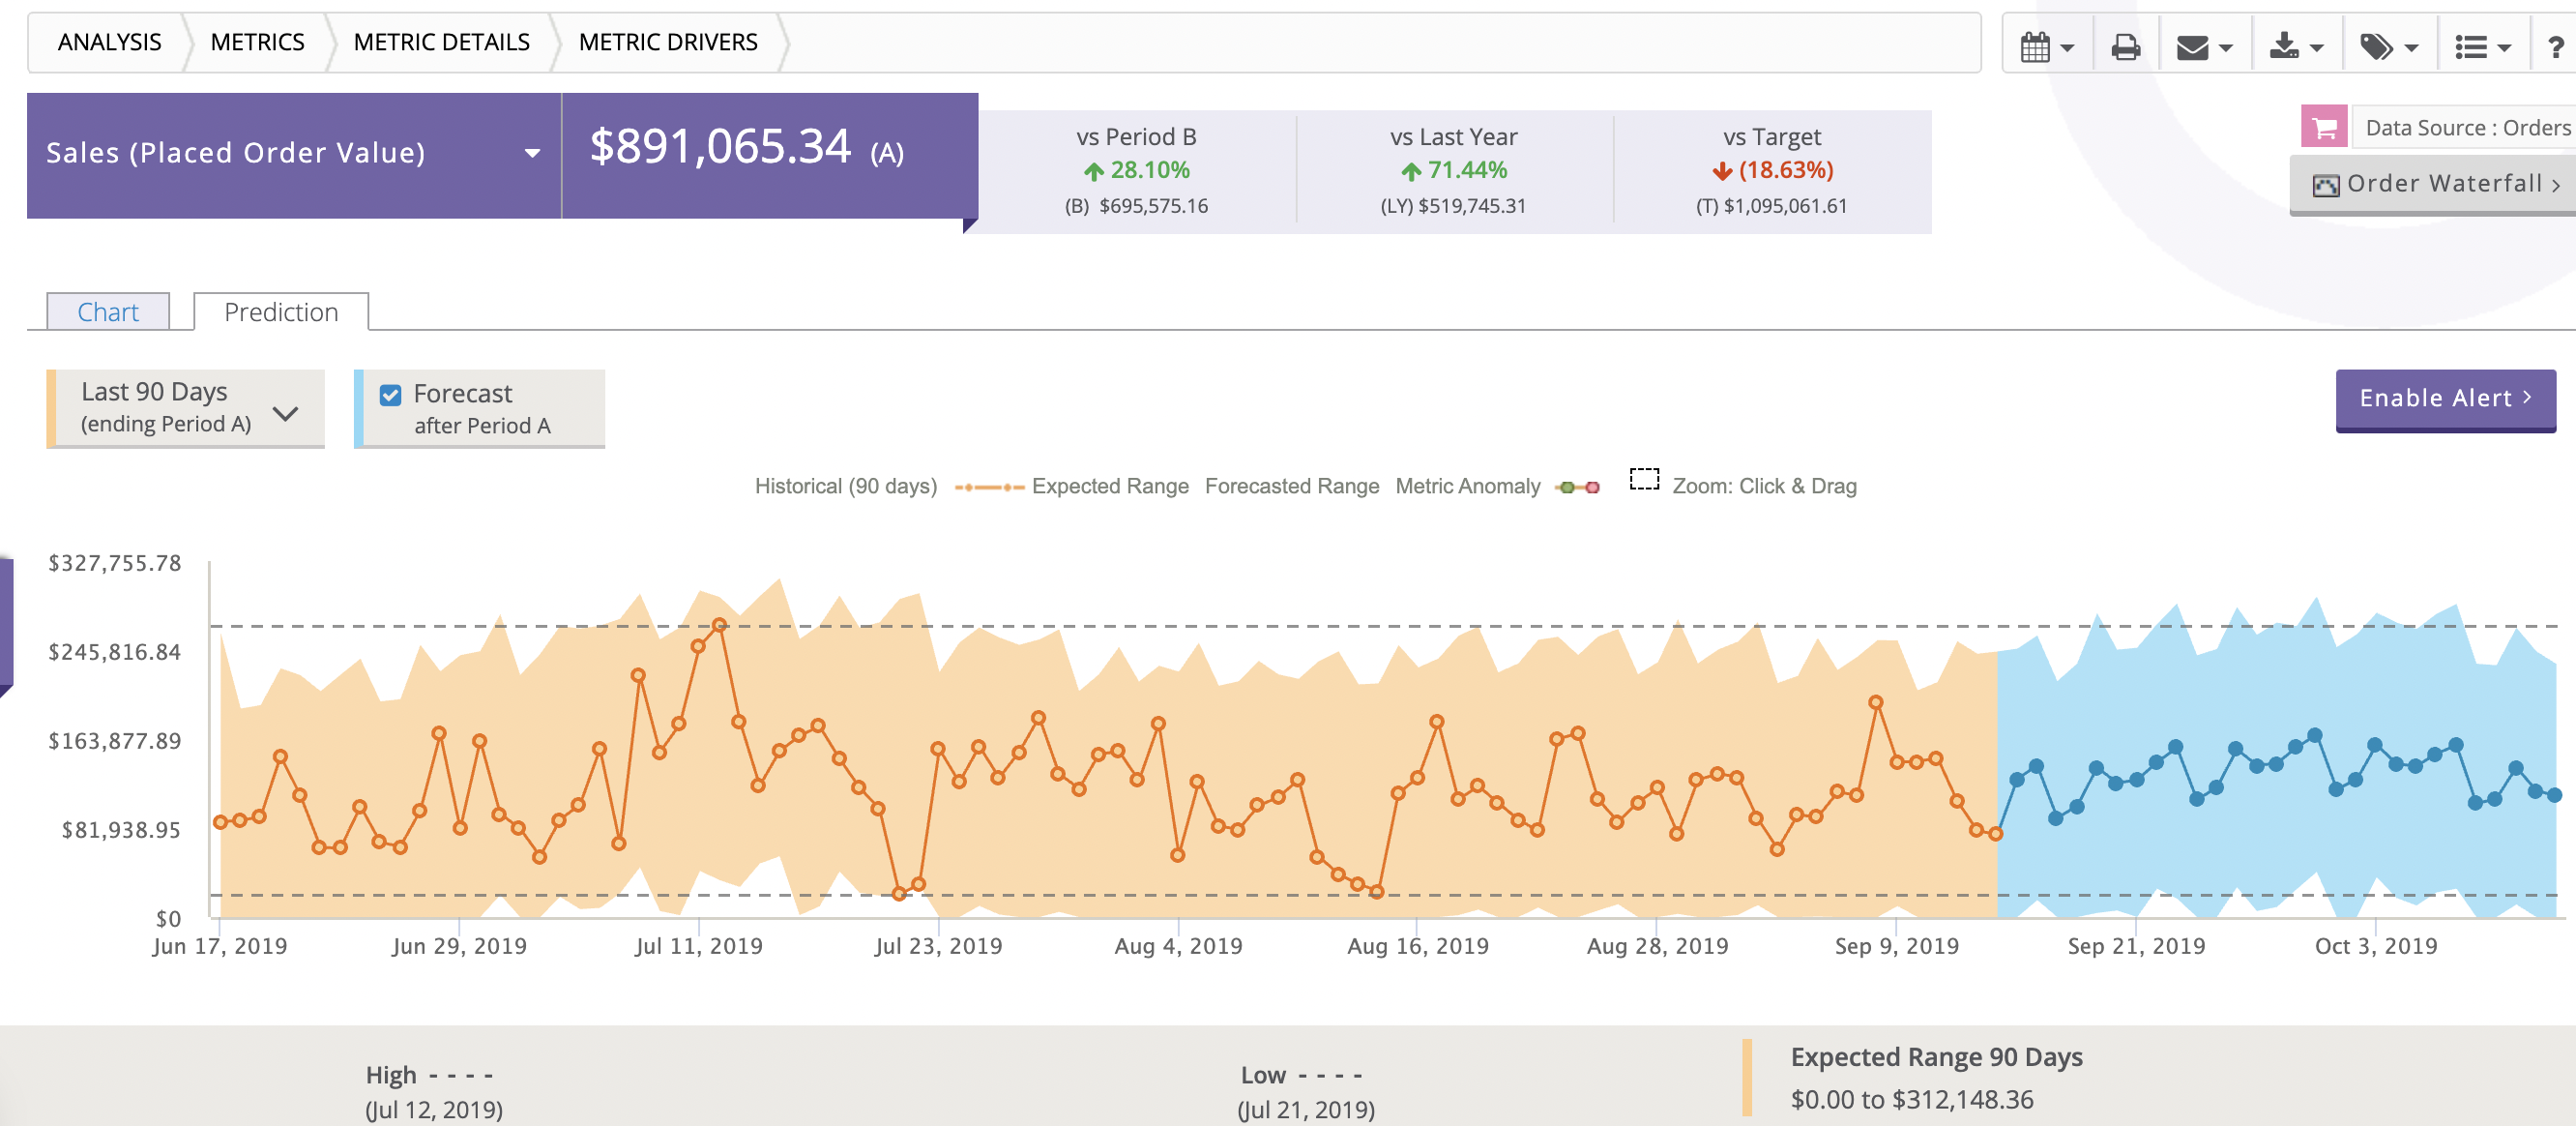
Note: The anomaly highlights are a precursor to a future automated metric alerting feature. In a future release, DynamicAction intends to give you the ability to be automatically alerted if a metric has fallen outside (either higher or lower) the predicted band range.
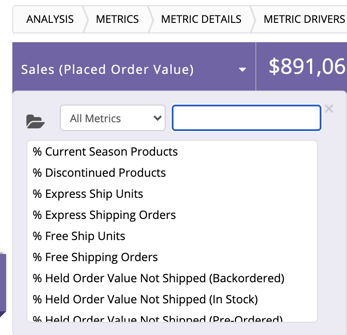
To toggle to an alternative metric, select the drop down arrow in the purple box and scroll or search to find your metric.
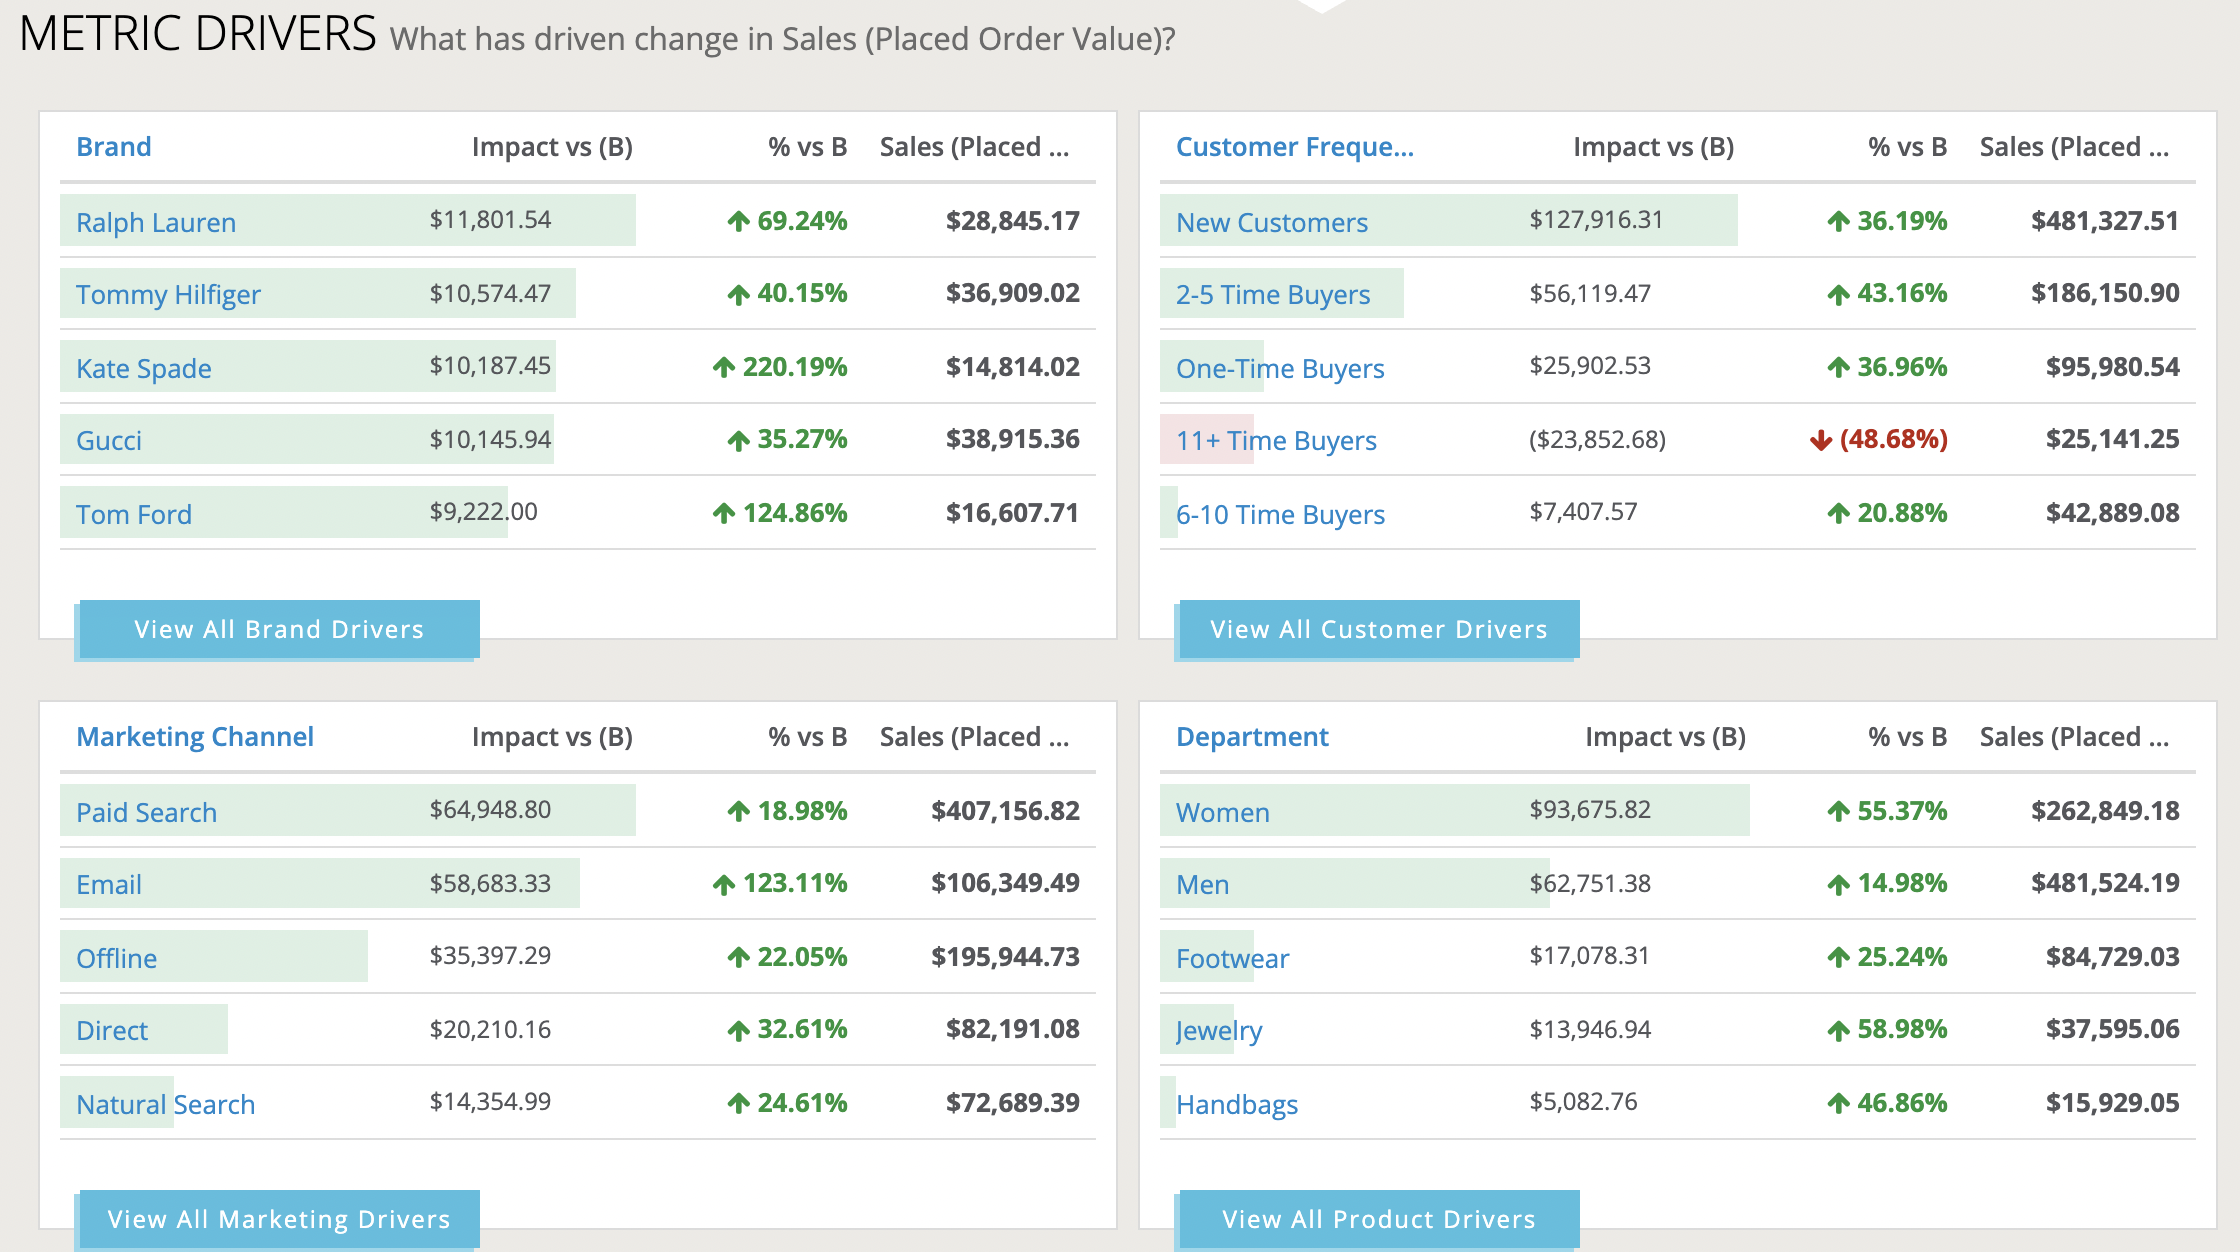
As you scroll or link down, you will find a Metric Drivers (see next section for more detail on Metric Drivers) overview that summarizes which values by dimension have had the largest impact on the metric in comparison to your Period B calendar selection.
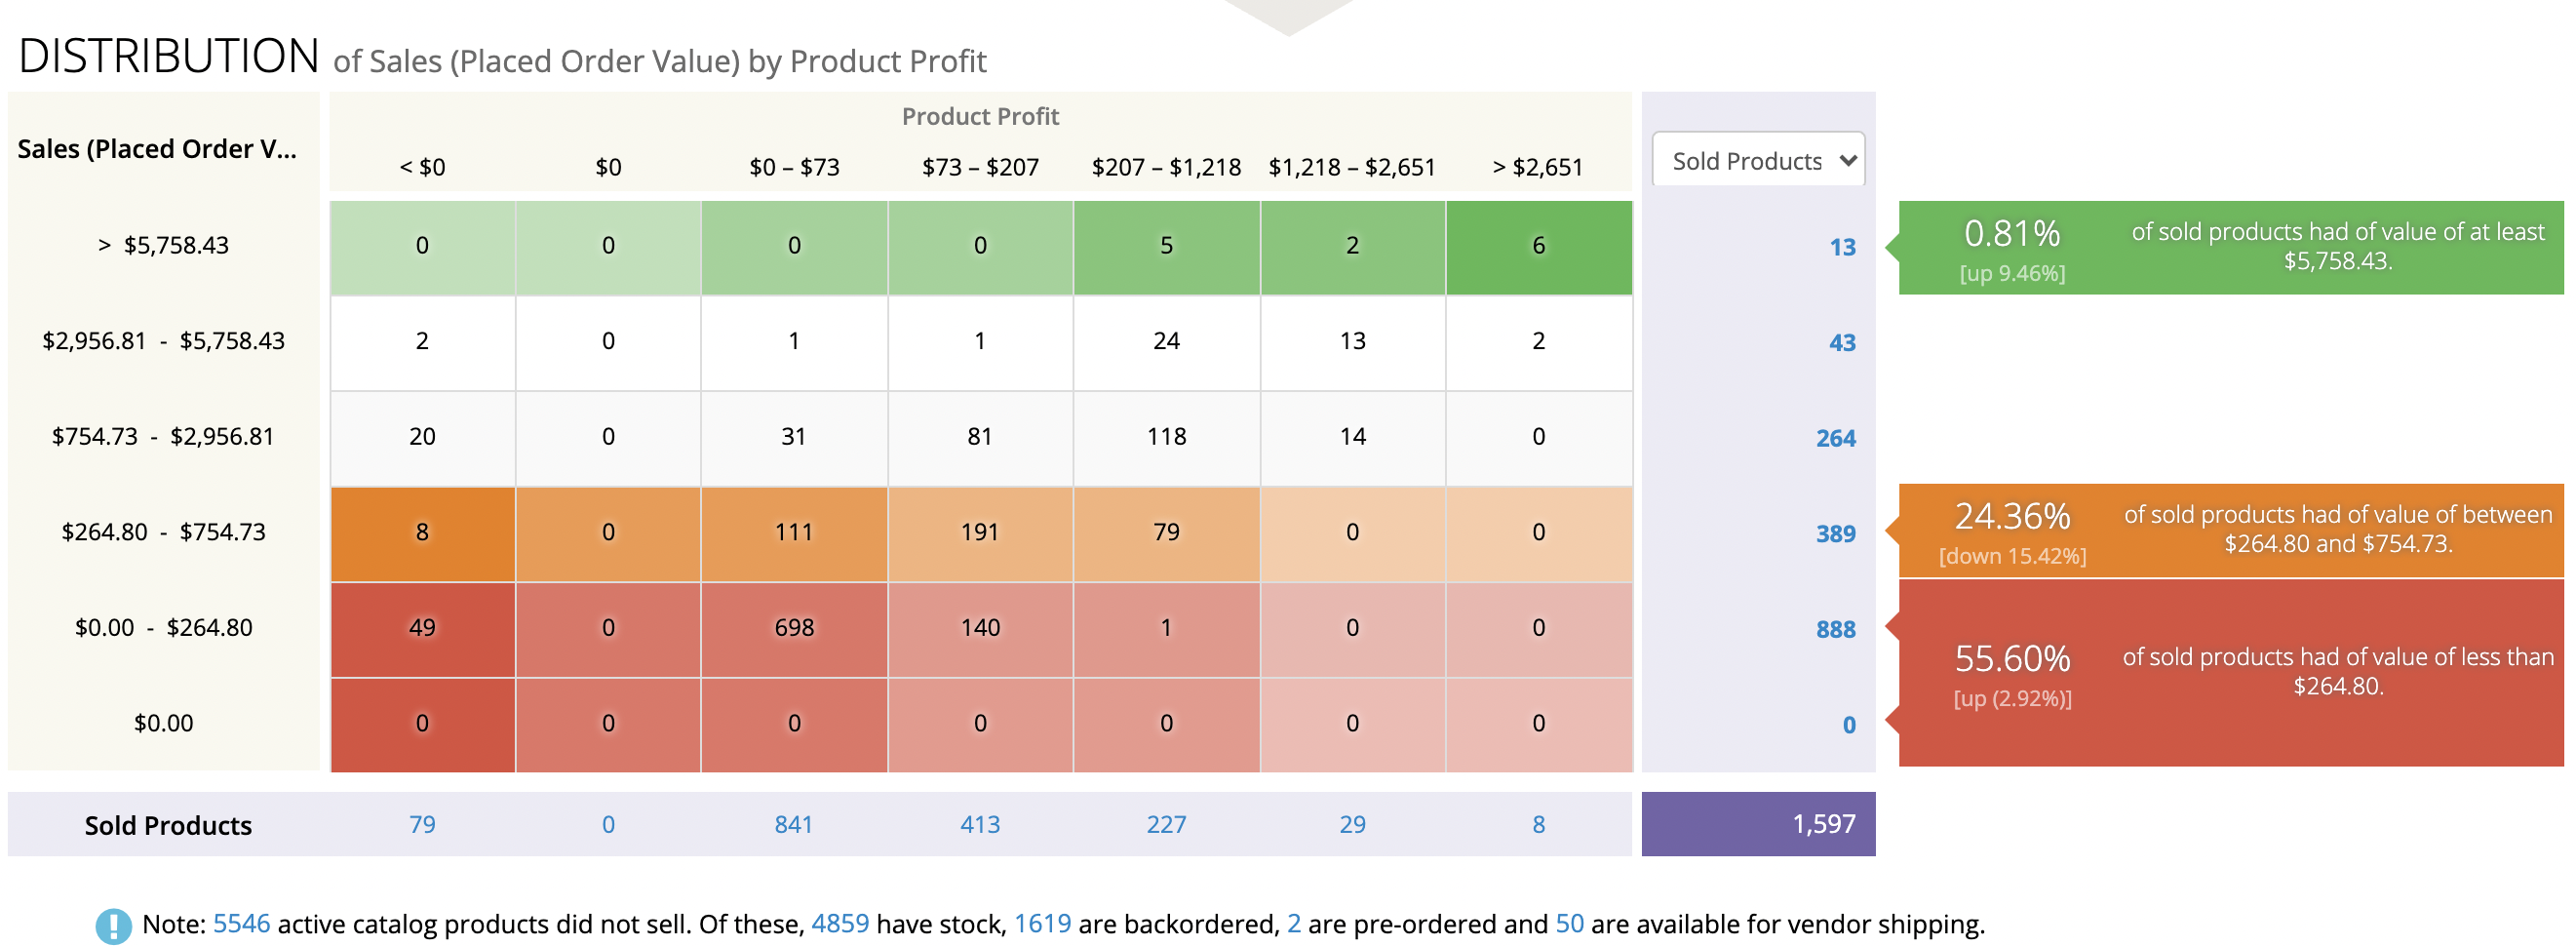
As you scroll down further, you will find the Full Distribution grid. Again, this section is not applicable to every metric. The grid features a heatmap to quickly summarize the cells that represent items that are in a good state versus those that need attention. You may toggle the drop down box to switch to a % view or potentially to an alternate metric. Clicking the cell values will navigate you to the Dimensions area to analyze or task the specific items that make up the selected cell.
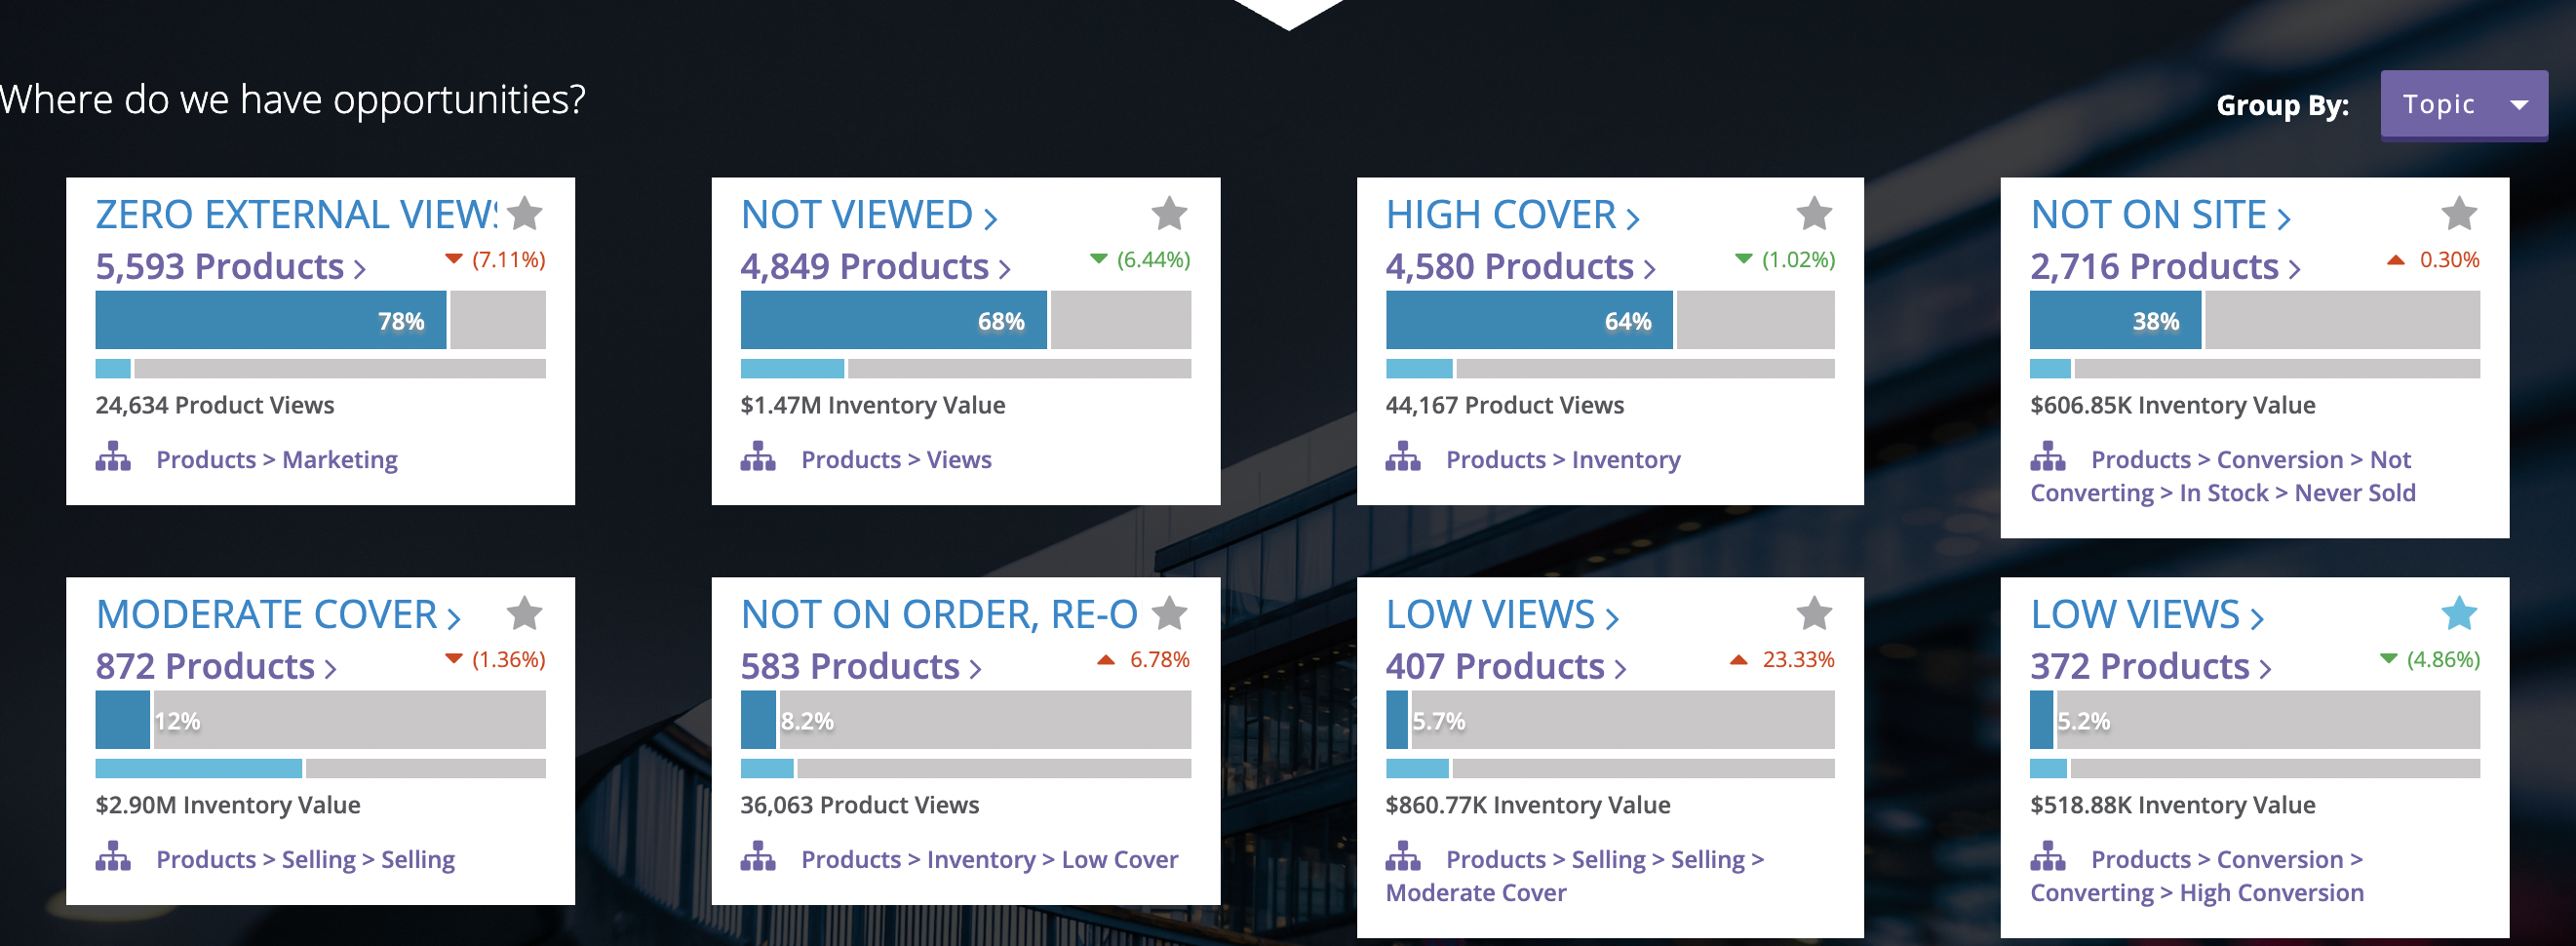
At the bottom of the page you will find opportunity tiles to navigate you to lists that can impact positive movement for your selected metric.