Build your workbook, choosing your Retailers, Brands, Gender, Product Type and Color filters as usual
Keep your In Stock filter selected to make sure you’re seeing products which are still available to buy now
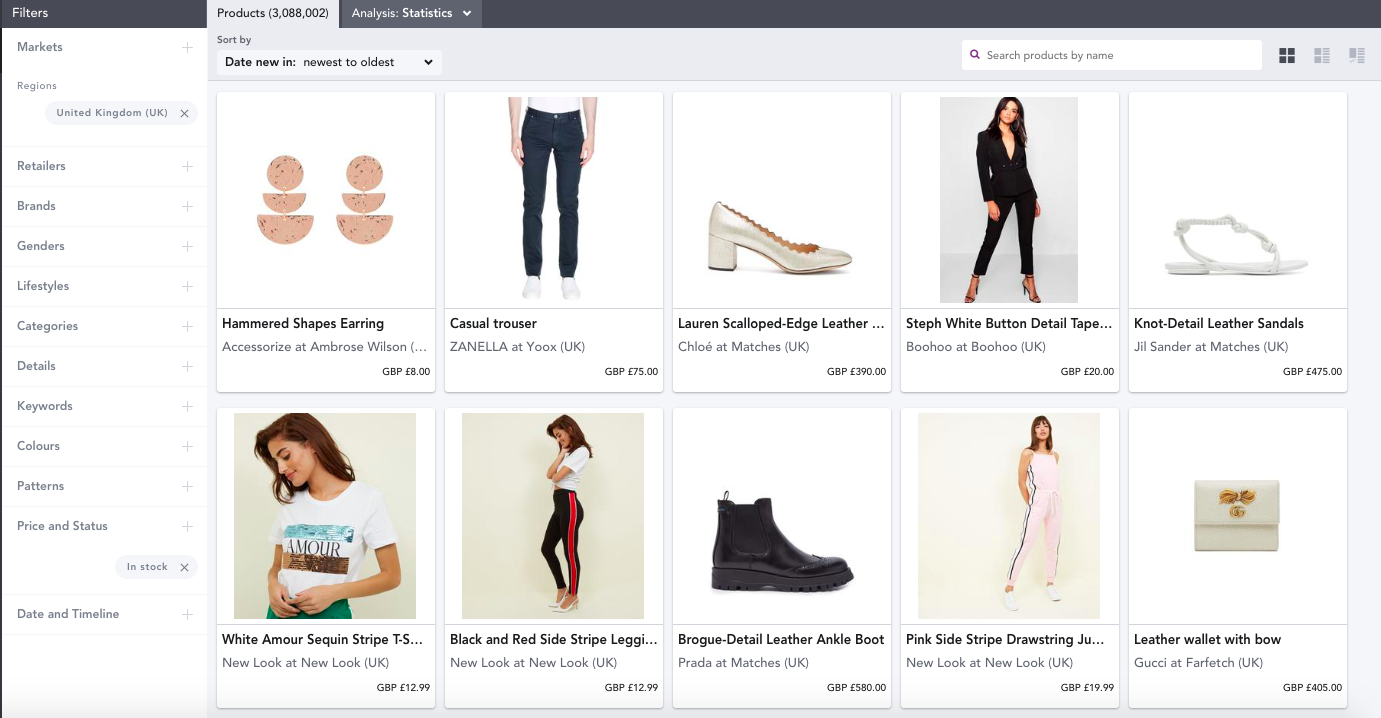
In this example, we’re looking at men’s T-shirts at the UK Market.
Follow the next steps to make sure you’re only viewing products which have been discounted, and never been replenished
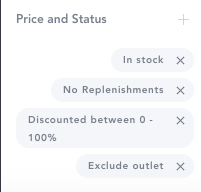
- In Price & Status, click Status and select Never under Replenishments
- In Price & Status, click Price > Price Changes and select Discounted
- In Price & Status filter panel, click on Outlet and choose Exclude outlet
- Use the list view to see, at a glance, the date at which a product dropped into the market, current stock, how many times it has been discounted in it’s lifecycle, and current level of discounting. (The list view is located in the top right hand corner of your dashboard, and looks like this):

Top tip: to identify poor performers, look out for products which have been in the market for a long length of time, have a high number of SKUs available, have seen consistent drops in price, and have a high level of discounting, like the t-shirt below

Click on a product to view it in more detail
- Scroll down to see SKU detail graphs. The first graph let’s you see peaks and troughs in a products lifecycle, whilst the second graph shows you how quickly SKU’s are selling out
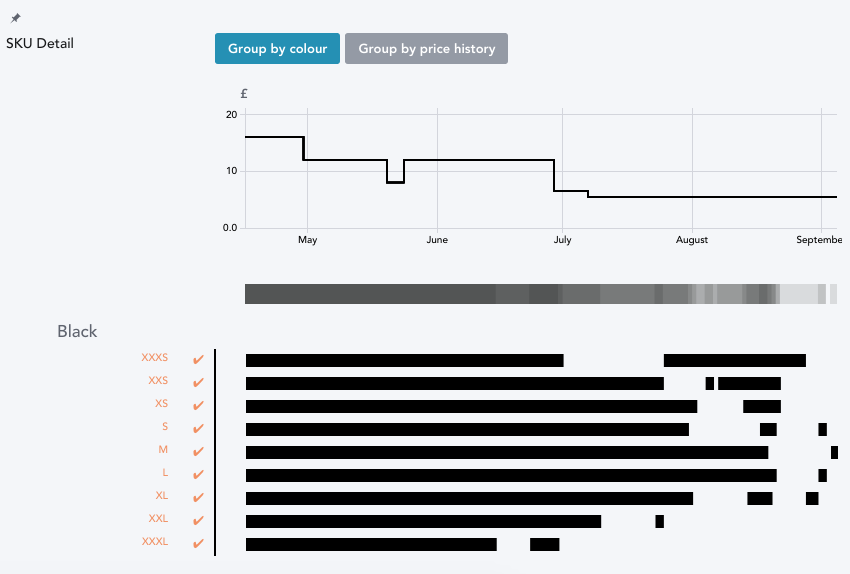
Top tip: to identify poor performers, look for products which display consistent drops in price whilst still having high stock levels.