To track a trend within EDITED, there are a few different tools that can help you get the fullest picture across the retail market. Retail Reports, Market Analytics, and Visual Merchandising all provide different types of data analysis that work together to identify key focal points of a trend.
RETAIL & RUNWAY REPORTS
Retail and Runway Reports are published by our team of in-house analysts, providing periodical analysis of key product categories and industry talking points, as well as data-driven analysis on emerging trends in runway and pop culture.
Within Retail Reports, the Trend & Culture and Social Media & Digital sections highlight the latest insights on pop culture trends, consumer habits, influencer coverage, and trending fashion topics to pay attention to on social media.
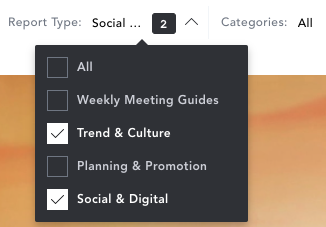
Browse the weekly/monthly trend roundups to discover trending topics, or use the search bar within Runway or Retail Reports to funnel your search and find reports related to the trend you wish to track.
As a sample case study, let’s track the patchwork denim trend of Spring/Summer 2021.
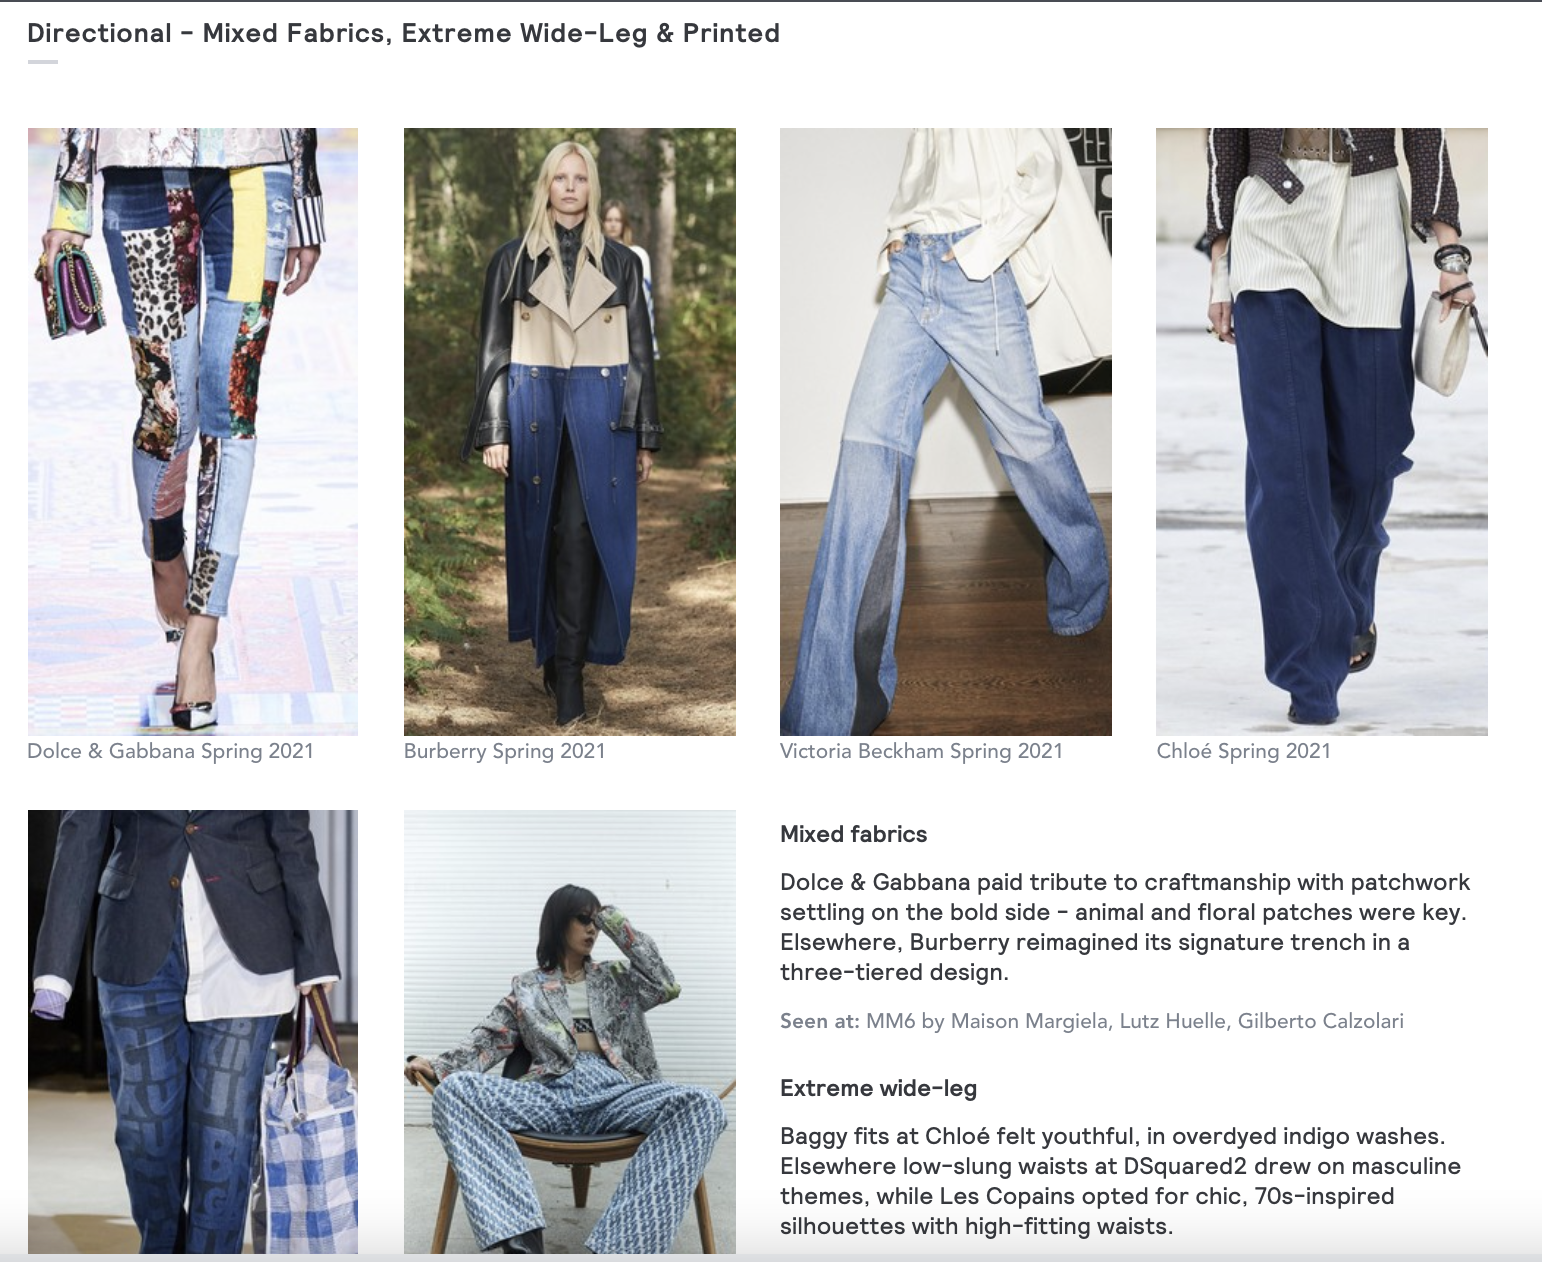
Looking at the Runway Report Womenswear: Spring 2021 Denim, mixed fabrics and patchwork are highlighted as emerging directional trends, suggesting that these pieces have the potential to garner press & viral attention.
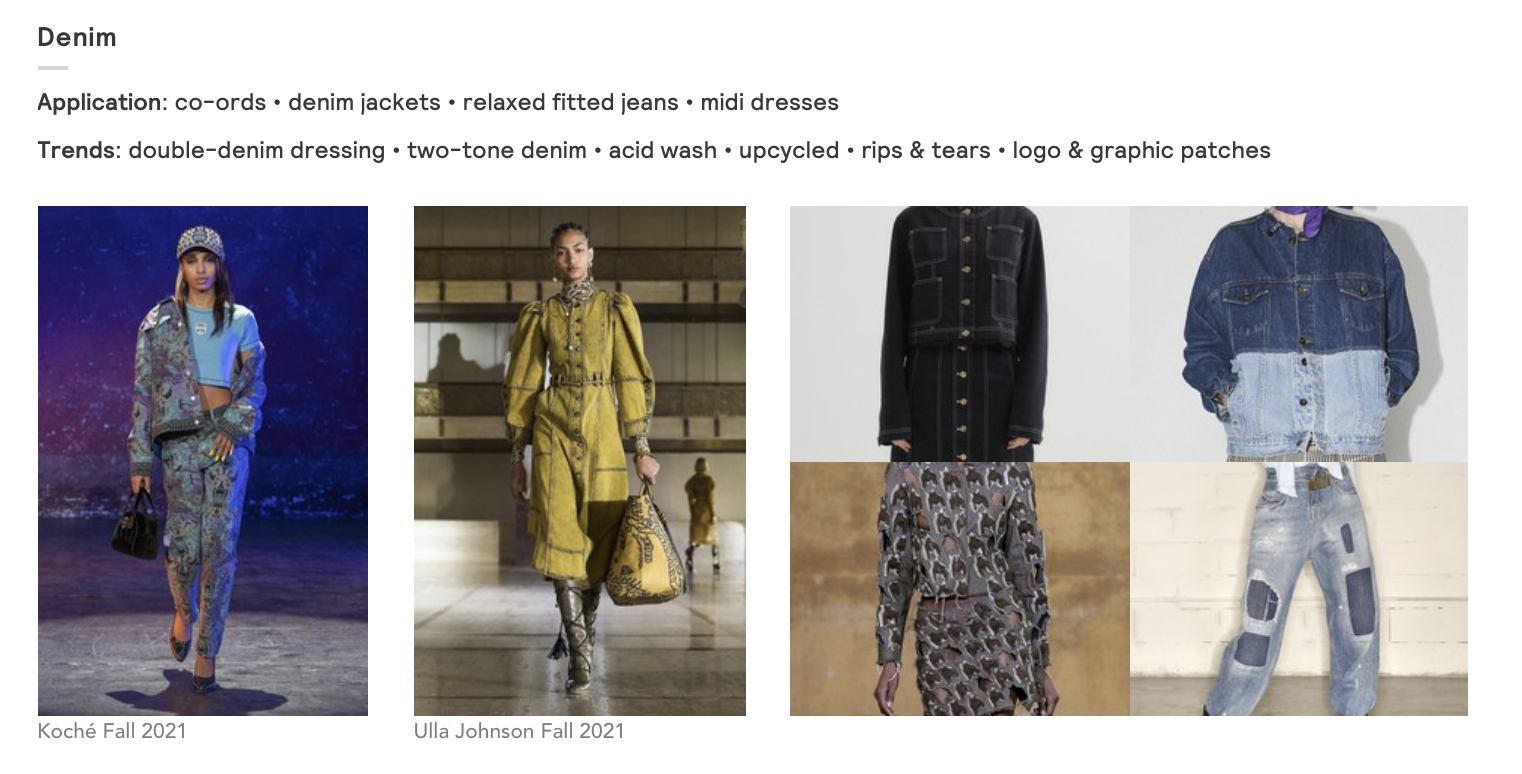
The Fashion Week ‘21 report for Fabrics also detailed how patchwork of mixed denim was still appearing on the runway.
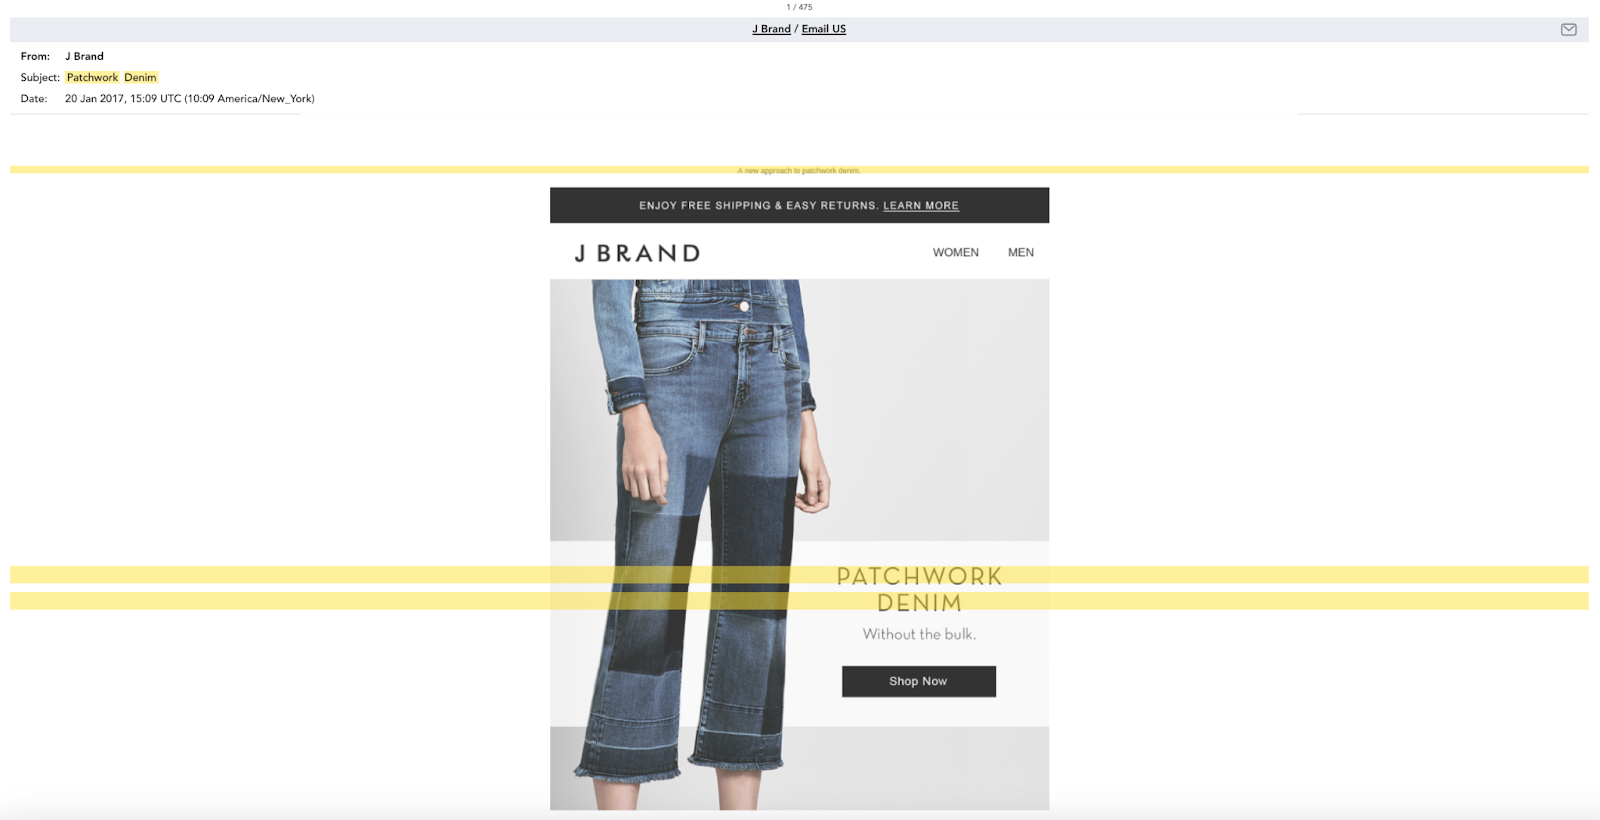
The Retail Report Womenswear: Perfecting the Patchwork Denim Trend provides an excellent in-depth look at these specific styles and how they were being marketed.
TIP: Check out The Trending Digest and Trending On Instagram retail reports weekly to spot new emerging trends within your market!
MARKET ANALYTICS
There are multiple tools within Market Analytics that will enable you to deep dive into specific trends within your own market and competitors’.
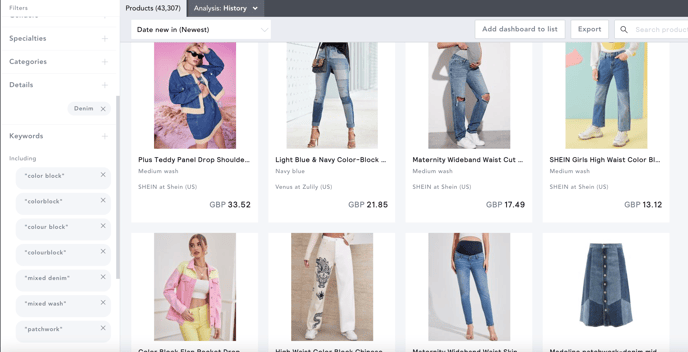
A great place to start is by building a workbook focusing on the style or trend you wish to track. Use the keywords filter to add any words related to the trend.
Utilizing our Top Movers methodology will allow you to analyze which styles have seen rapid sellouts and replenishments, indicating a spike in popularity. You could also use our First Majority Sellout filter to spot any new trends in the market early!
For more on how to set up a workbook to highlight Top Movers, click HERE.
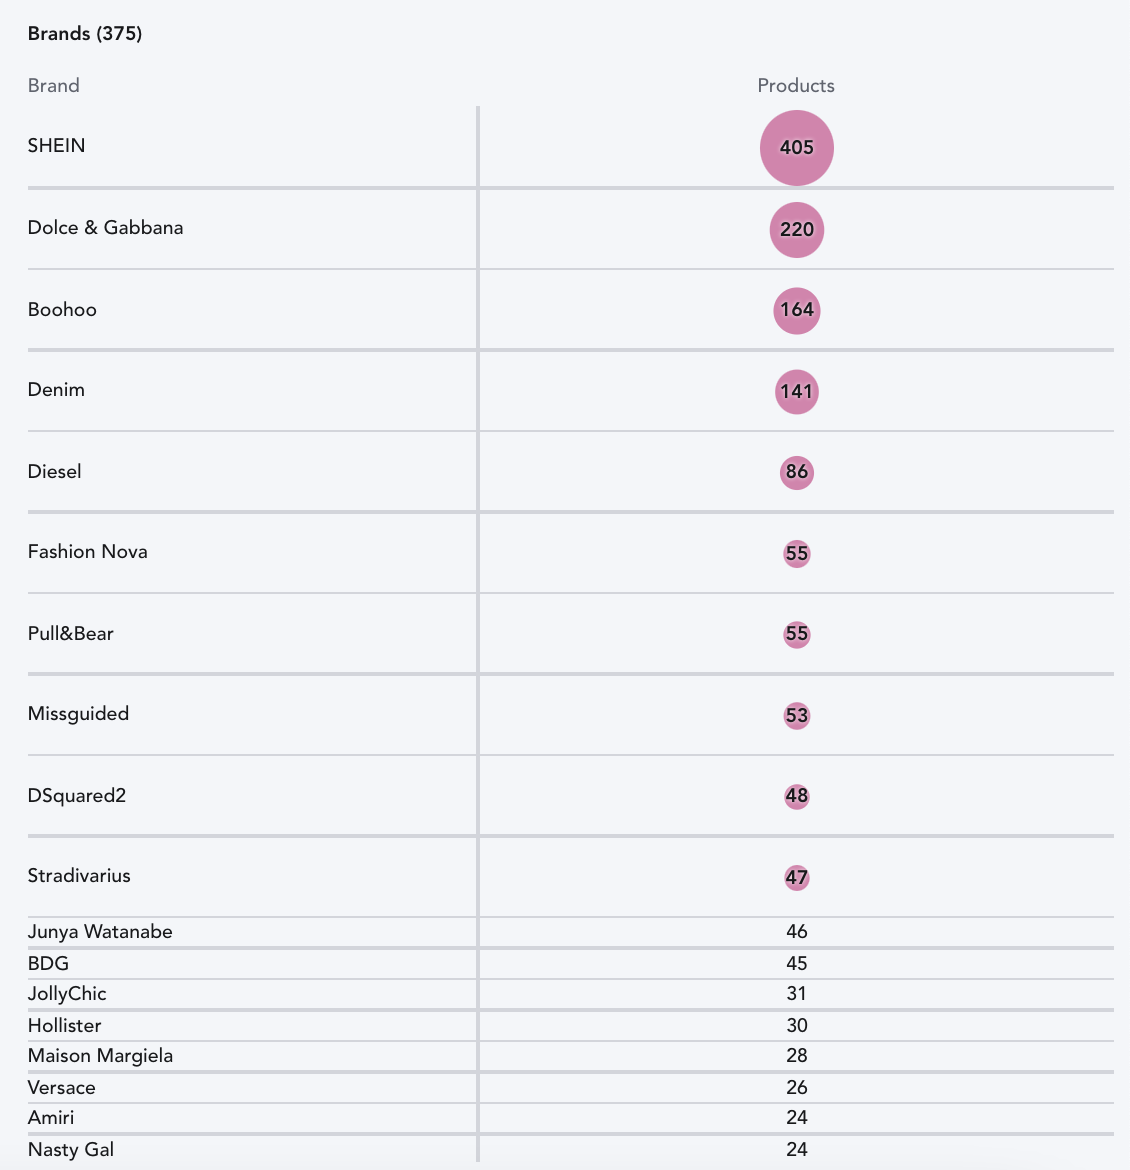
Who & Where will help you analyze which brands have the most items stocked across this trend. In the patchwork denim example, you can see that across the UK & US, SHEIN has the products available on this trend, with Dolce & Gabbana as a more premium brand following suit, and fast fashion retailers such as Boohoo and ASOS close behind.
TIP: Set up email alerts to notify you of new product launches related to this trend workbook to get the insights sent directly to your inbox. For more on how to set up email alerts, click here.
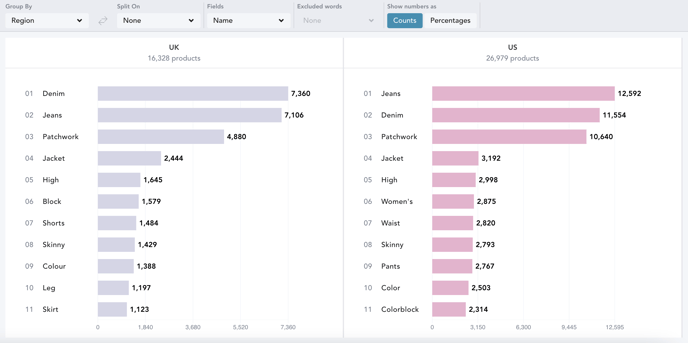
Top Words is another great tool to identify trending words and product types within a retailer’s assortment. This chart will display the most frequently used words on a retailer’s site in that product category.
Under the Fields dropdown, you can select whether the words being tracked are found in the Name, Description, or Care & Composition of each product page. For example, if you are searching for a particular shape or cut, you may want to select Description, whereas prints would more likely be found in the Name of the product.
Click on the X next to any word to exclude it from the chart if it is not relevant to your analysis or you would like to narrow down the data selection.
TIP: You can cross reference these Top Words by searching them on Google Trends for a look at how they appear in customer search activity and observe how the interest over time has grown or diminished for these trends.
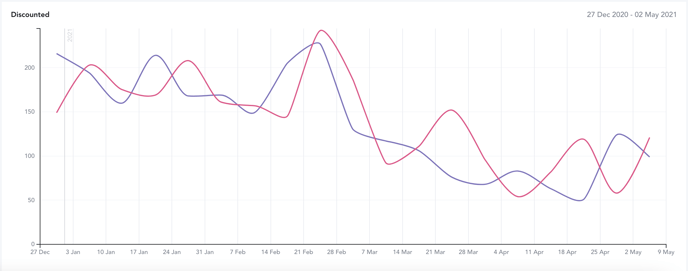
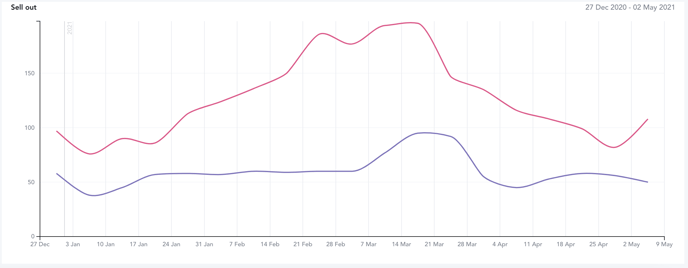
History will enable you to analyze how certain products have been trending over time.
Here, we can see that the patchwork trend has been gaining momentum across both the US & UK regions. The month of February saw a peak in new arrivals of this product type in both markets, preparing for the Spring season.
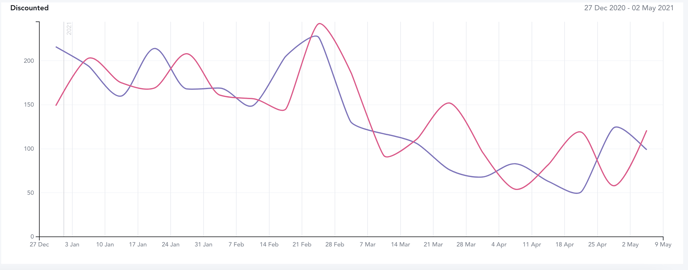
Alongside this, sell-outs are beginning to hold strong as discounting reduces, proving it to be a key trend in the market in early Spring 2021.
Assortment can be used to understand how the product types were broken down in this trend, and serve as a great way to spot opportunities within different product categories.
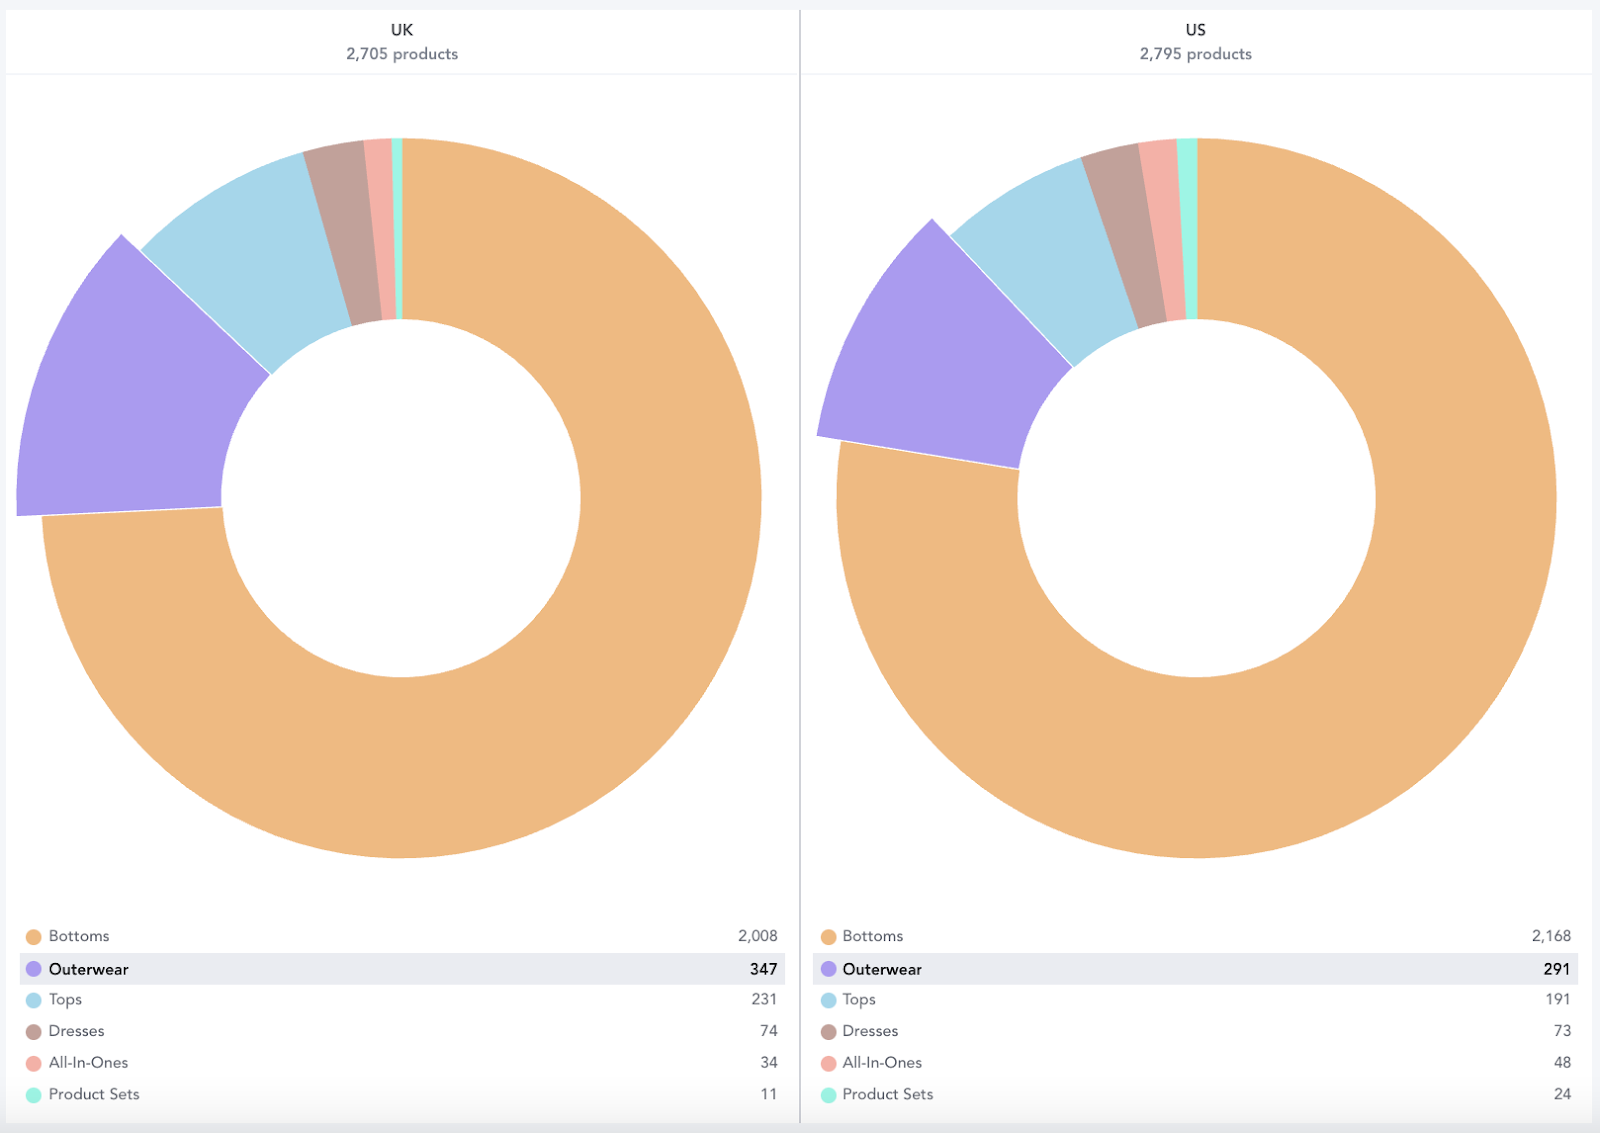
In this example, you can see that the UK has a slightly higher mix of patchwork denim across outerwear & tops than the US. Does this potentially demonstrate the UK market is more receptive to this trend in less traditional garments? Could this be an opportunity for the US market to lean harder into other product types?
Color provides a visual representation of which colors are being invested into within the trend. You could also use this tool when monitoring color trends to understand which specific TPX color codes are prominent in the market.
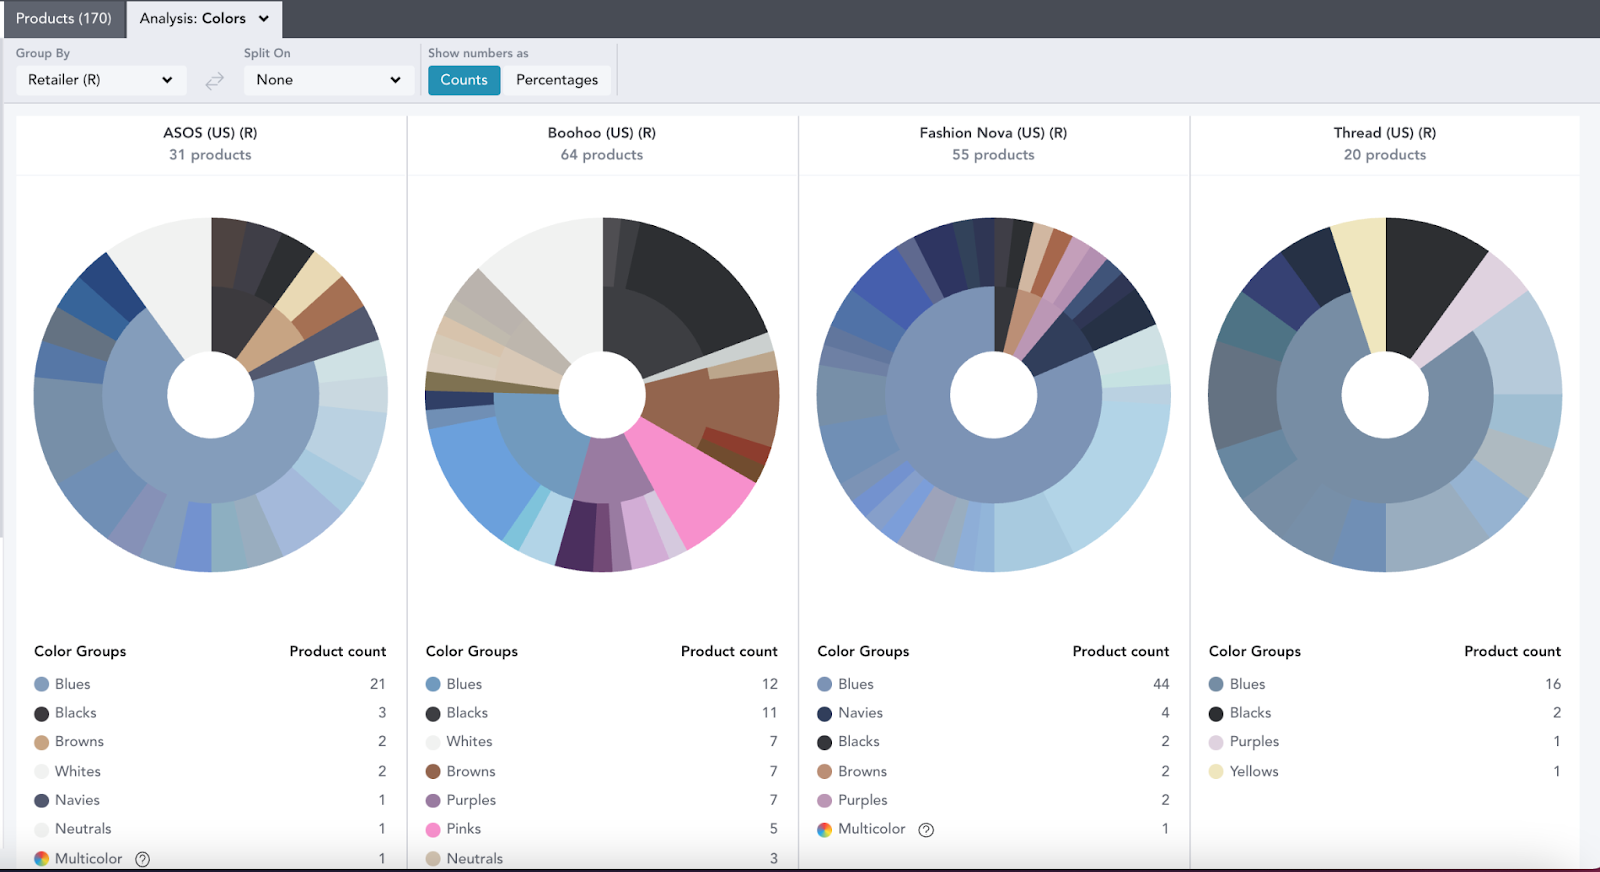
Within our patchwork denim workbook, this Color chart lets us know that Boohoo and FashionNova are the only retailers branching out to focus on new colors such as lilacs & pinks, potentially suggesting an opportunity for other retailers to expand into untraditional color offerings.
VISUAL MERCHANDISING
The Visual Merchandising section is the best place to analyze trends and campaigns advertised across email communication and messaging on retailers' direct sites. By clicking on the Channels filter, you can select to view a site’s homepage, category landing pages, emails, and blog posts.
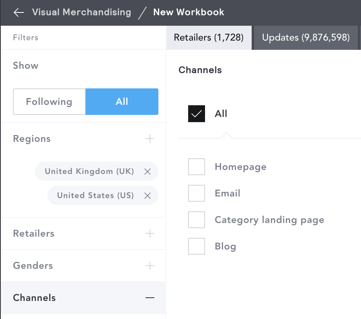
Use the keywords filter to search for specific words or phrases you would like to include within the Visual Merchandising communication search. For example, you might search for keywords such as patchwork and colourblock/colorblock. Narrow this search even further by using the search bar at the top of the workbook to drill down to specific words or phrases, such as “denim,” within the already keyword-focused selection.
From here, you can use the Heatmap Analysis tab to analyze which days had the highest mention of these keywords and on what dates these retailers started communicating about this trend.
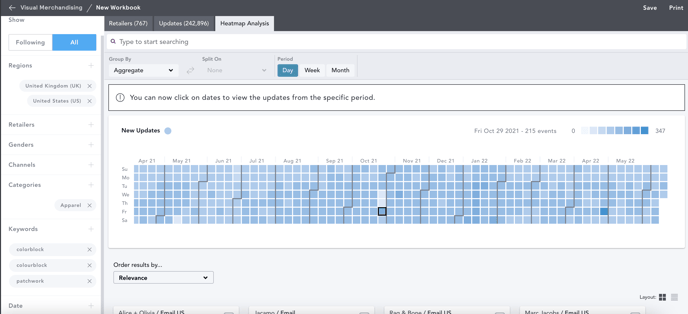
Within the Heatmap, the darker a square appears, the higher the frequency of keywords were tracked on that particular day, so you can gain a visual representation of a trend’s growth cycle as mention of the keywords increased across communication.
You can click on any square to highlight a specific day to see just the communications from that particular day and analyze exactly how the words were used, back in the Updates tab. Clicking into an update will also show you a screenshot of exactly where these words appeared on the page, letting you see the product images and language being used to promote this trend.