Join our expert team for an insightful session packed with practical tips and strategies for staying ahead during peak trading this year. Now is the most critical period in the retail calendar and we want to show you how you can harness the power of
Click HERE for webinar recording
Recorded October 2023
In this webinar, you will learn:
- How to build your discounting workbooks within EDITED Market that you can use from today through the end-of-season sale
- Identify the trends and categories your competitors are promoting and discounting (plus the most popular discount brackets)
EDITED’s In-Season Trading Step-by-Step Guide
Messaging: What key promotions are my competitors communicating to customers right now and at what frequency?
Tool to use: Visual Merchandising
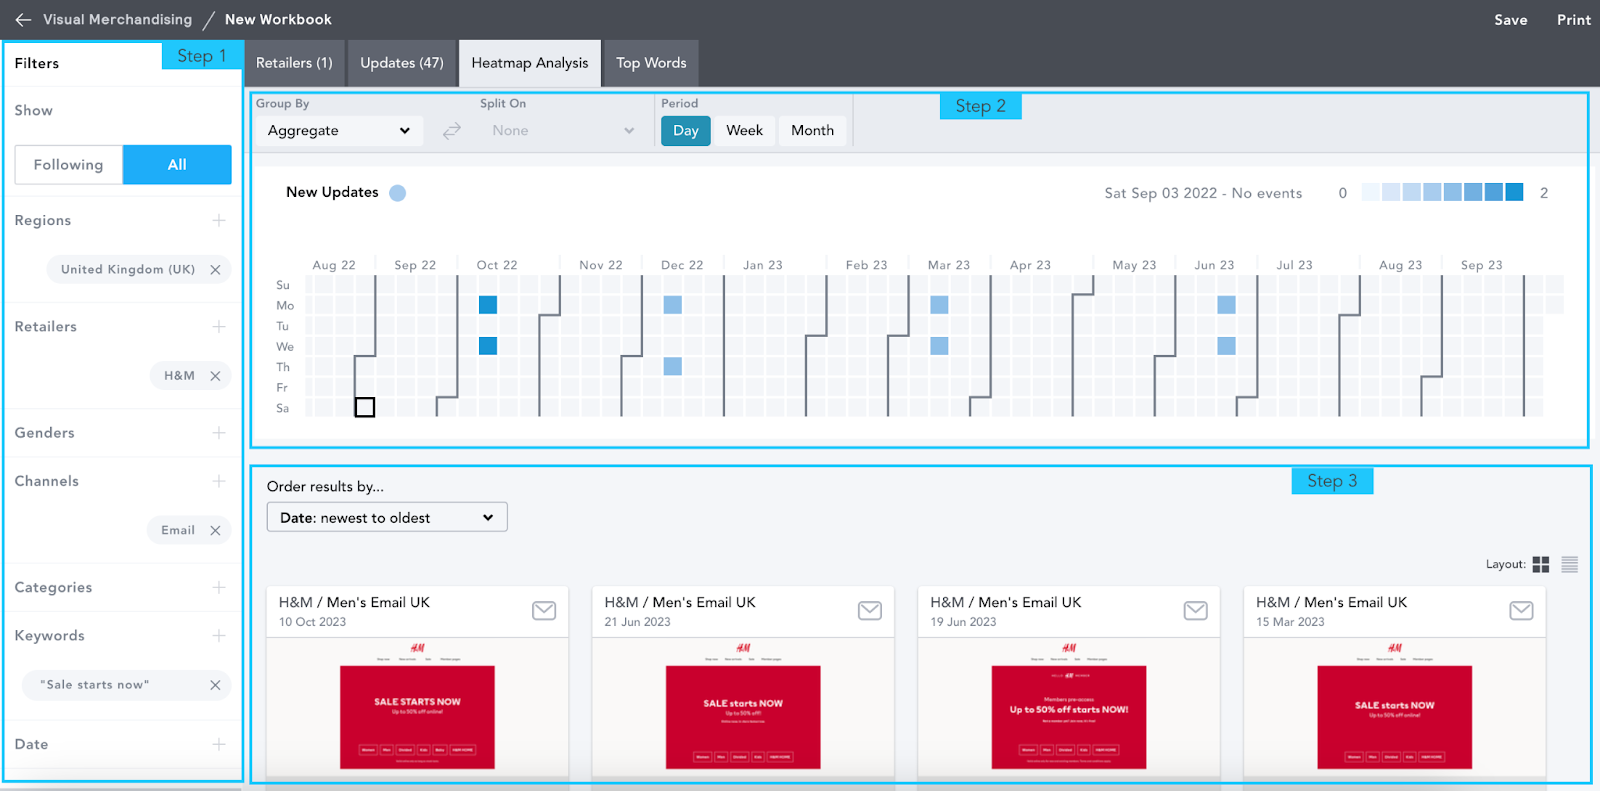
Step 1 - Setting Up Your Workbook
-
Select the region(s) and retailer(s) relevant to your analysis.
- Choose your channel. We recommend either:
- Emails: The promotions your competitor was emailing to customers
OR - Homepage: The positioning and weighting of messaging on a retailer’s main page
Keywords:
- Phrases must be put in quotation marks “xx” e.g. “Sale starts now” or “Member Days”
- Boolean searches are possible with AND e.g. “Sale” AND “Member”
- Date: Select the period you want to analyze or leave the date off to see all communications.
Step 2 - Heatmap Analysis
- Here, you can understand your competitor(s) communication activity.
- Identify the first and last communication, as well as frequency YoY.
Step 3 - Email Analysis
- Click into individual emails to analyze promotions, key phrases, and discount codes offered at your competitor(s).
Discounts: What proportion of products are on offer at my competitor and which categories see heaviest reductions?
Tool to use: Discounts
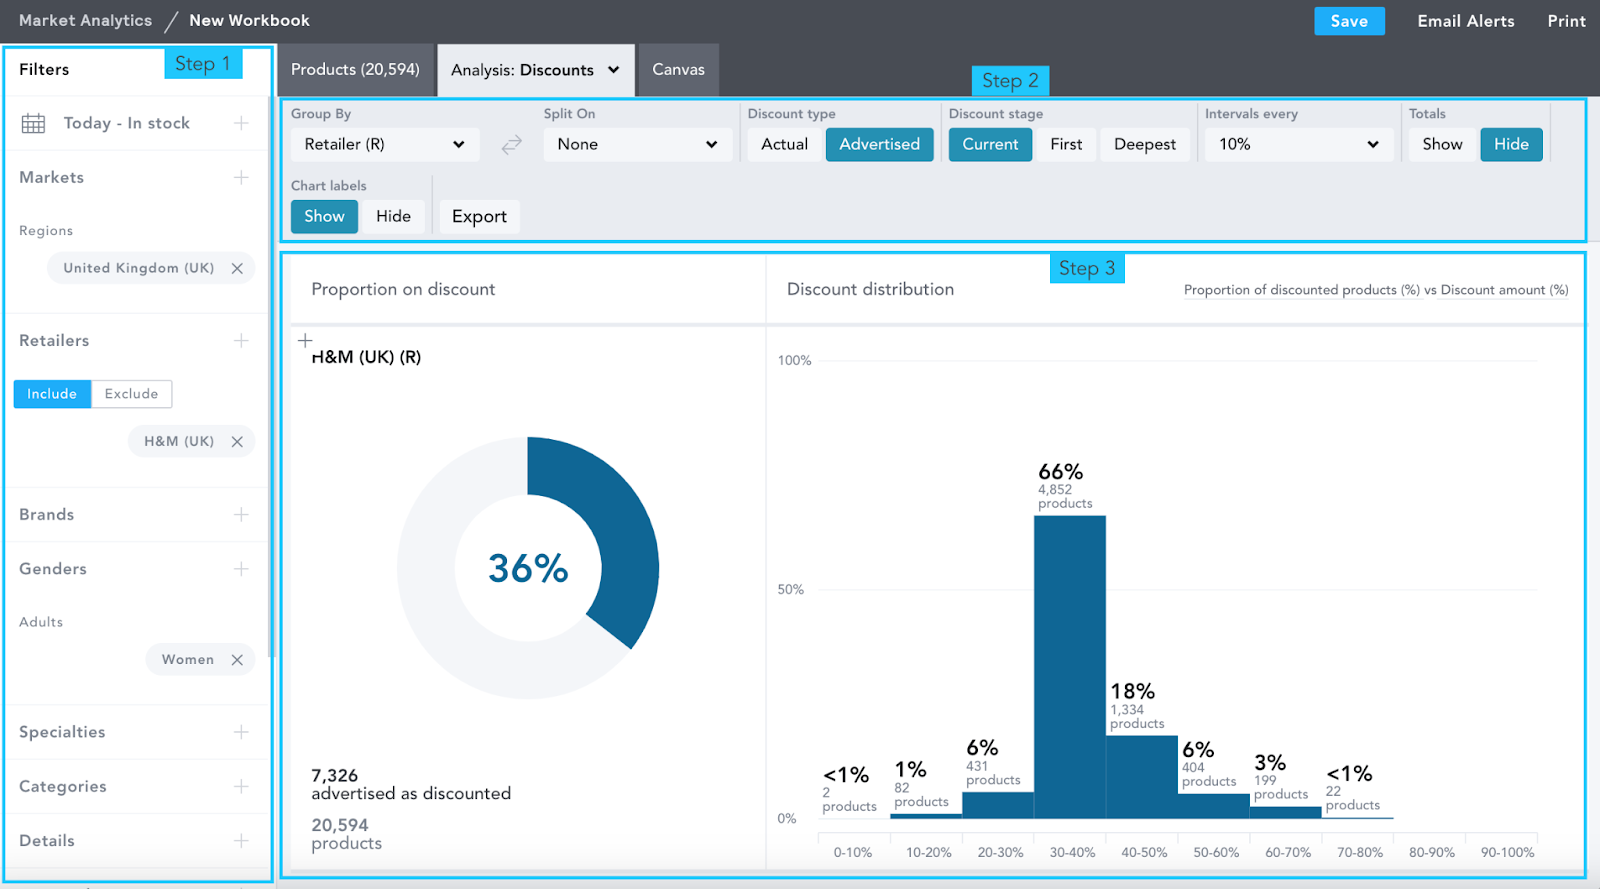
Step 1 - Setting Up Your Workbook
-
Set the Date & Timeline filter in the top left corner to in stock, today to give you the most current insights.
- Pricing and discounts will appear as they are the day selected.
- Email support@edited.com if you don’t have access.
-
Select the region(s) and retailer(s) relevant to your analysis.
- You will now have an aggregate view of your competitor(s) overall discounting on this date.
Step 2 - Setting Up Your Discount Chart
- Select your discount type
- Actual: Products with a price reduction that EDITED has tracked. A product will be identified as being discounted if the price of any SKU drops below the highest price EDITED has ever tracked for that product
- Advertised: Products that see a price reduction communicated by the retailer to its customers online.
- Select your discount stage
- Current: The percentage of the assortment that is currently discounted across a retailer, brand, product type or assortment. This will be reflective of the date set in your Date & Timeline filter.
- First: The level of discounting tracked by EDITED the first time the price of a product was reduced. This is particularly helpful when looking at a discount period like end of season sales. You could compare by retailer to see who discounted the most first. Did they go straight to 50% off or start more conservatively at 20%.
- Deepest: the greatest level of discounting that EDITED has tracked on a product. A good example for this is if you want to understand what discounting bracket most products fell between at their deepest discount we’ve tracked so far.
- Select your Intervals. Each interval will include products from the lowest percentage decimal in that bracket, up to .99% before the highest value of that bracket. For example, if your intervals are set to 10%, then all products with prices between 0 and 9.99% off will fall within this bracket.
Step 3 - Category Discount Analysis
- Hone in on the category most relevant by unselecting all other categories in the filter panel.
- Drill down further into the category by adding keywords and/or details.
- You can then split on these details or keywords for more in-depth discounting analysis.
Steps 4-6 - Category Discount Analysis
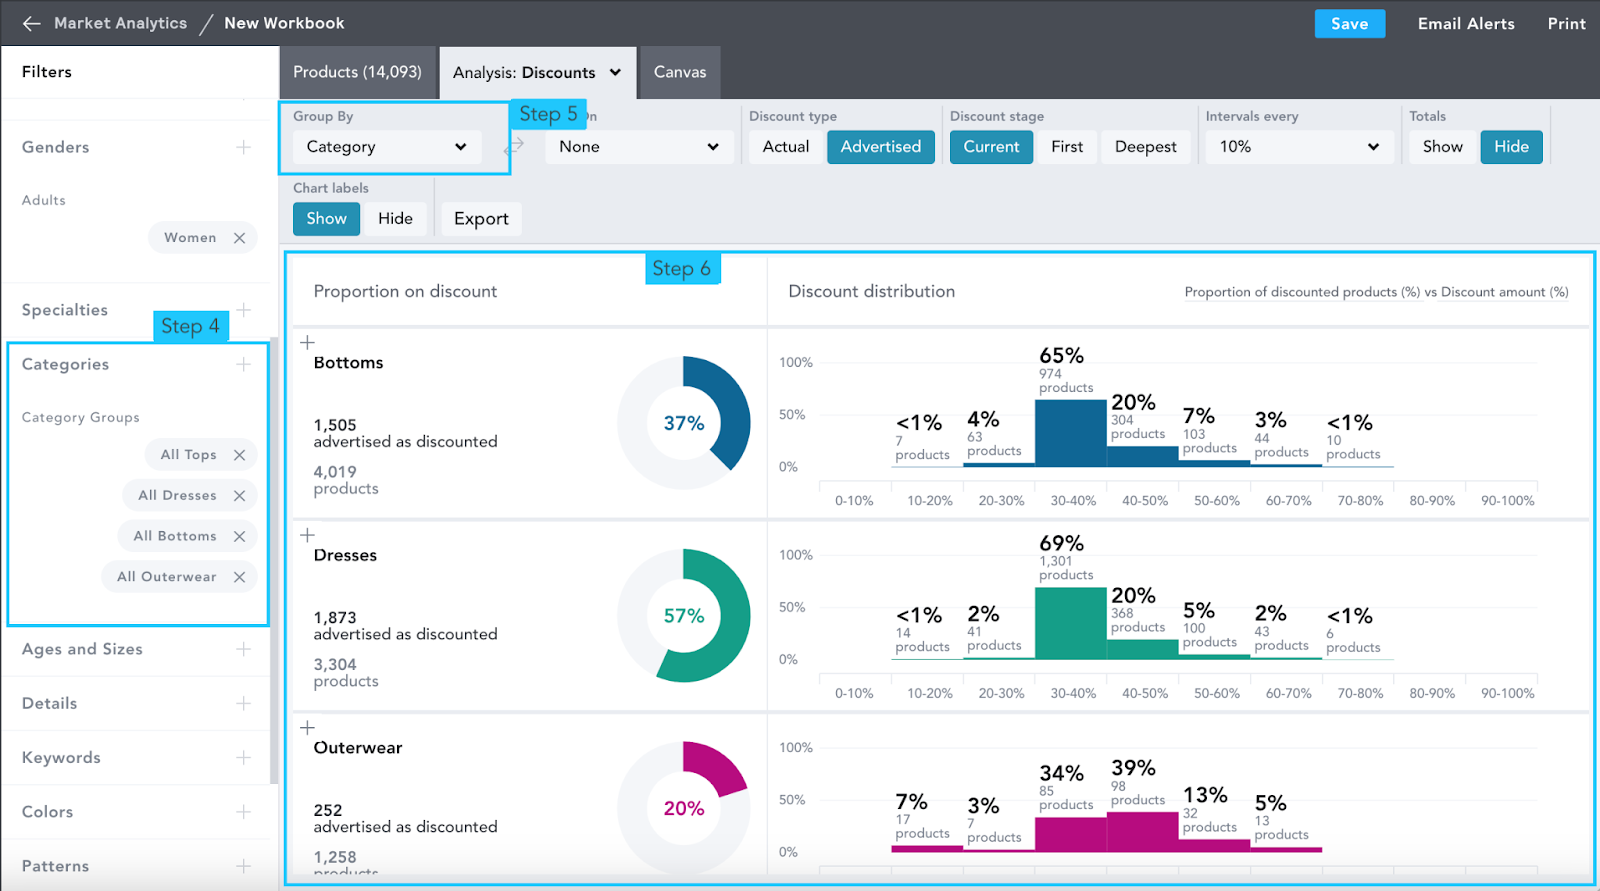
- Step 4: Add your categories of interest into the filter panel
- Step 5: Group by Category to see an individual discount breakdown per category
- Step 6: You can now view the the distribution of discounted products within your workbook in customizable percentage intervals per category.
Discounts: How many new season options are being reduced?
Tool to use: Discounts
Step 1 - Adjust Price & Status Filter
-
Within your already set up workbook in Discounts (see above steps), click into Price & Status within the filter panel and add New In > Past Three Months, or use the calendar to set specific new in dates.

- This will allow you to see the distribution of discounted products within your workbook in customizable percentage intervals for everything new in on your set dates.