When completing historical analysis in EDITED, there are a couple of things to bear in mind to ensure the data you’re analyzing is an accurate representation of what was happening in the market at the time.
Price & Status filters are all referring to the Price & Status of the product the last time we saw it on the retailers’ site. For example, if you wish to analyze products that were in stock on your competitor’s sites in May 2026, you can set an In Stock date range of 01/05/2026 - 31/05/2026.
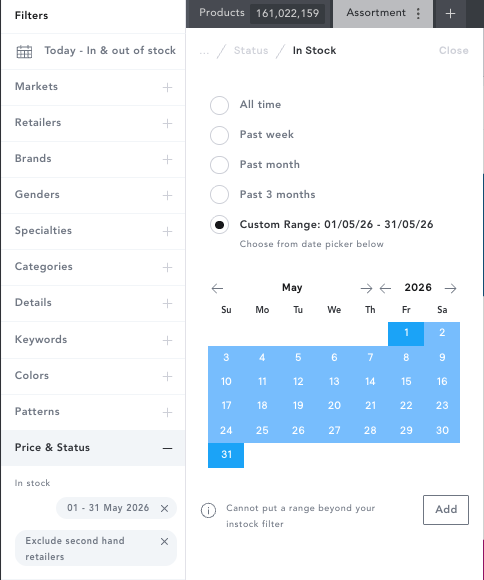
In order for all products in stock during that range to appear in your workbook, you must make sure the top date filter (aka "Rewind Time") is set to Today - In & out of stock to display all products in stock in May 2026, regardless of their stock status today.
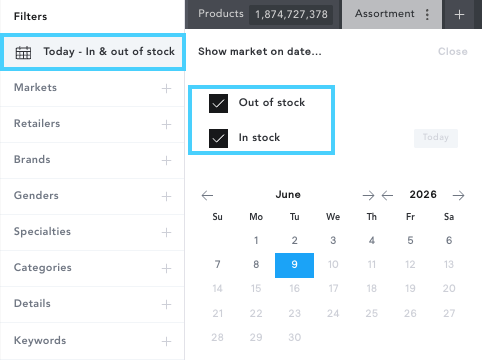
If this filter is set to Today - In stock + an In Stock date range within Price & Status, you’ll only be seeing products that were in stock in May 2026 that were still in stock the last time we tracked the retailer’s site.
This also applies when analyzing New In, First Sell Out, First Majority Sell Out, and First Discounted within the Price & Status filter.
What if I want to carry out historical pricing analysis, but don’t want to analyze the discounted price?
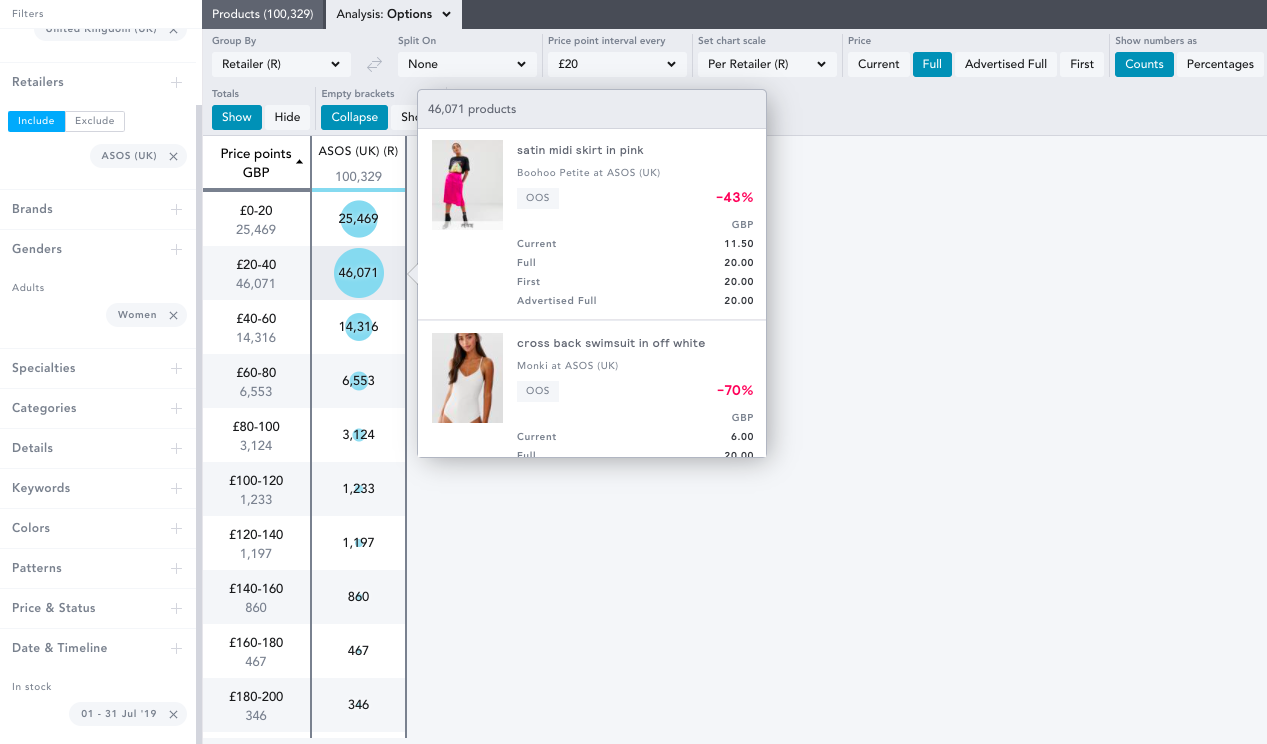
When you jump into any of our Pricing tools, providing you have Full or Advertised Full selected within the in chart controls, this will be analyzing the full or advertised full price of these products.
For example, in the below workbook although the satin mini skirt is showing at a 43% discount, because Full is selected within the in chart controls, this product is falling into the £20-40 interval, because the full price of the skirt is £20.
Why don't the products in the "Products" tab match up to the ones in the "over time" charts?
The historical charts will show the products as they were captured literally on the day/week/month in question. Imagine an option as a book - if you're on the Products tab or any of the other analysis charts (non-historical), you're looking at the cover of the book, or the most recent version EDITED has seen. If you are in a historical chart or using the Rewind Time date filter, you may be looking at the exact page for April 1, 2026 featuring the price, stock status, discounts, etc. as they were seen on that very day frozen in time.
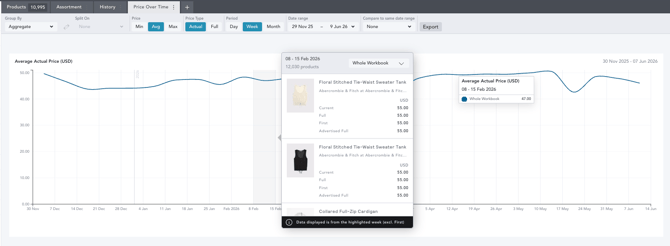
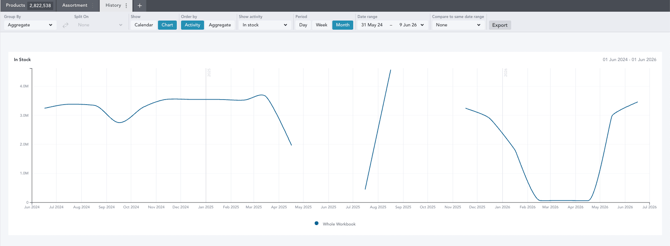
When you see a large gap in a trendline in a time chart, that usually indicates that either the products were genuinely OOS during that window, or there was an issue with the tracker. If a tracker ever goes down due to changes with the retailer's site and needs repair, we will lose product data in that window, as we wouldn't want to infer something we have not truly seen.
It is expected that option counts will fluctuate due to stock status and new launches across a timeframe - and therefore will not correspond to the Products tab (products appearing in the chart popovers for historical timeframes may not be still in stock today for example). It is also possible if things like gender, brand, or category change over time - either due to a genuine change in the way the retailer lists them, or an update to EDITED’s taxonomy or re-classification of erroring products - this could impact those specific windows where the product had previously displayed information not caught by the filters. To revisit the book metaphor, on a few "pages of the book" a product was previously listed as Men's but a few pages later it was relisted as Unisex - if you have a unisex filter applied, it will disappear from the chart on the days when it was associated as Men's, and will not backfill the new field.