-2.png?height=120&name=EDITED%20Logo%20Dark%20-%20Color%20(1)-2.png)
- Help Center
- How To Use EDITED Overlay
- Overlay FAQ
-
How To Use myEDITED
-
How To Use EDITED Market
- Getting Started With Competitive Market
- Building & Managing Competitive Market Workbooks
- Using Competitive Market Workbook Filters
- Competitive Market Workbook Advanced Filtering
- Competitive Market Analysis Types: Analyzing Products In Workbooks
- Competitive Market Analysis In Practice
- Classic Competitive Market Dashboards
- Lists
- How Does EDITED Competitive Market Work?
- Sharing EDITED Data
- Market: Understanding Terminology & Methodology
- EDITED Support
- Frequently Asked Questions
-
How To Use EDITED Digital & Omni
- Getting Started: Navigation & Administration
- Getting Started: Control Panel
- Analysis Types: Dashboards
- Analysis Types: Insights
- Analysis Types: Opportunities (Decision Trees)
- Analysis Types: Opportunities (Action Impact)
- Analysis: Opportunities (Product Badges)
- Analysis Types: Basket Analysis
- Analysis Types: Tasks
- Getting Started: Using Charts
- Getting Started: Exporting, Sharing, Saving & Downloading
- EDITED Digital/Omni FAQ
- EDITED Digital/Omni Data Sources
- DynamicAction Glossary
- Release Notes Archive
- Additional Administration
-
How To Use EDITED Research
-
How To Use EDITED Messaging
-
How To Use EDITED Overlay
-
How To Use EDITED Signal
-
How To Use EDITED Match
-
Webinars
How are Peer Percentiles determined in DynamicView?
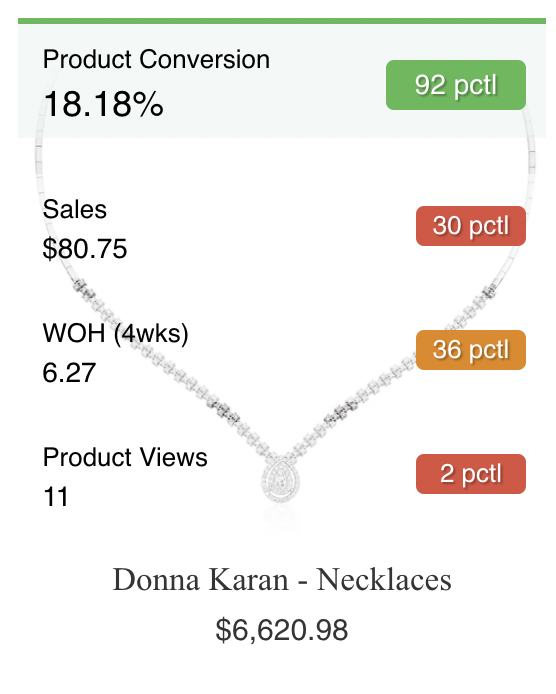 Peer Percentile:
The Peer Percentile comparison value identifies where the product sits relative to its category peers. For example, a product in the 8th percentile in terms of the Product Conversion metric suggests that 92% of other products in its category have higher Product Conversion rates. For most metrics if the metric value for a product is in the 1-30th percentile, it will be colored red. If the metric value is in between the 31st and 69th percentile it will be colored amber and if in the 70th percentile or higher it will be green. Do note that there are some metrics where the percentile values are the opposite. For example, a product having a low Peer Percentile value for the metric Bounce Rate means that the item is less often associated with a one page visit. So for that metric, Peer Percentile values less than 30 would be green and those over 70 would be red.