-2.png?height=120&name=EDITED%20Logo%20Dark%20-%20Color%20(1)-2.png)
Ad Hoc Analysis
Dimensions Analysis
The ad hoc dimensional analysis feature offers users the ability to select desired data dimension combinations, metrics, charts, and comparisons. Once a desired view is reached, users may bookmark the view for easy access in the future, task the view to initiate action workflow or identify opportunities for the chosen report.
Dimensions Analysis Options
Under the “Dimensions” menu in the left navigation, you will find your options for ad hoc dimensional analysis. Your selection simply defines your starting point. For example, if you would like to analyze categories, departments, divisions, brands, products, etc., select “Products.” The default starting point will be an analysis of top level Product Categories, but you may switch to an alternate product dimension (e.g. brands, product name, product attributes, etc.) While you must start with a dimension that matches your left navigation choice, you may pivot to another dimension at any point. For example, you might view Product Category 1, and then drill into Brands, then drill into Product Names, then choose to view Marketing Channels. Or, if you prefer, you may show multiple dimensions side by side as fields. You may select up to 2 different dimension categories (e.g. Product and Marketing or Product and Promotion or Marketing and Customer, etc.) and multiple values within each category.
In this example, the result reveals which Marketing Channel drove the most demand to the Womens Dress Category.
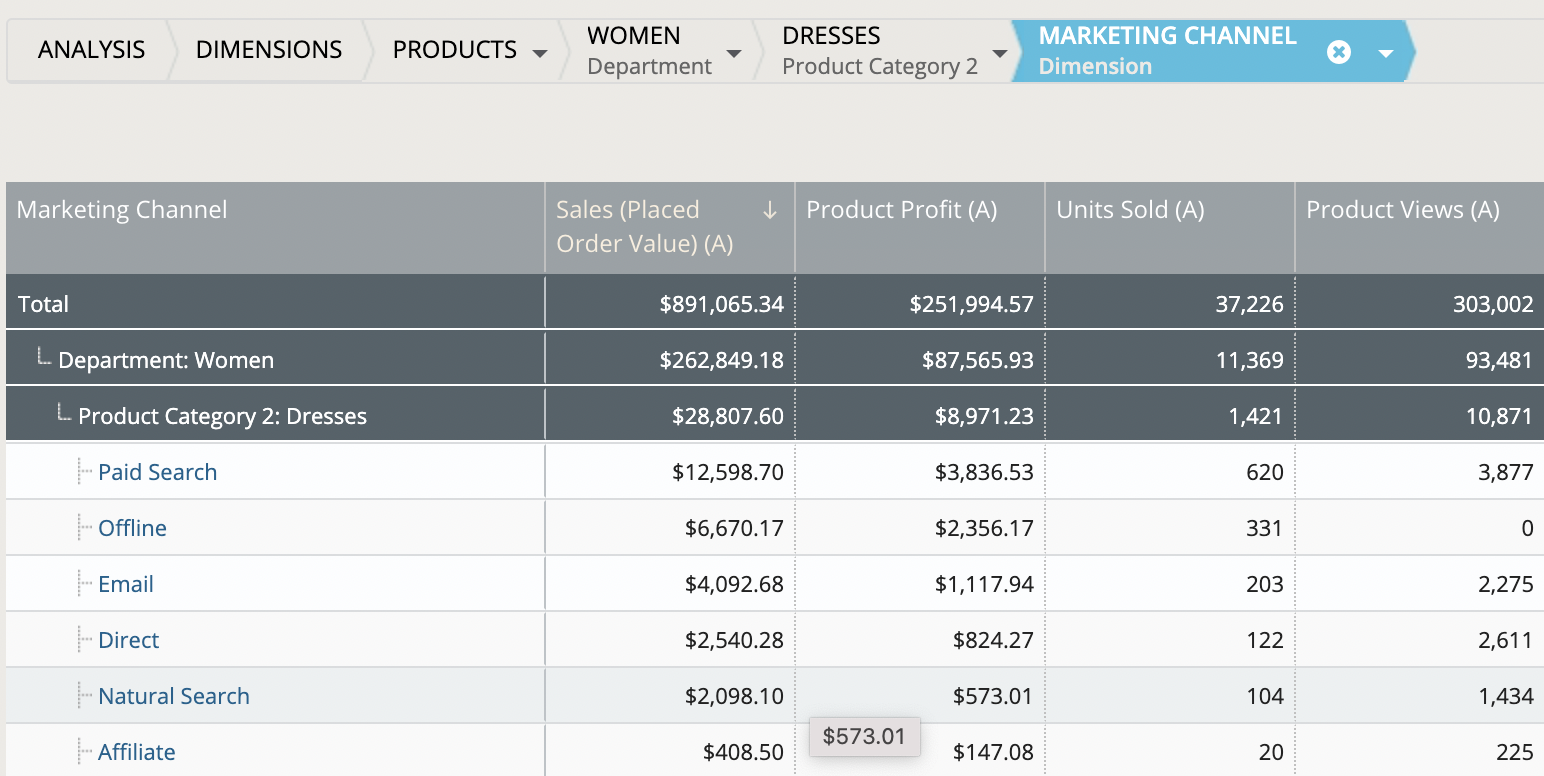
The breadcrumb at the top of the page controls what you primary analysis is in the first column of your table. In the above example Marketing Channel is selected in the breadcrumb, therefore the primary table analysis is analyzing Marketing Channels in the first column.
 Data Table
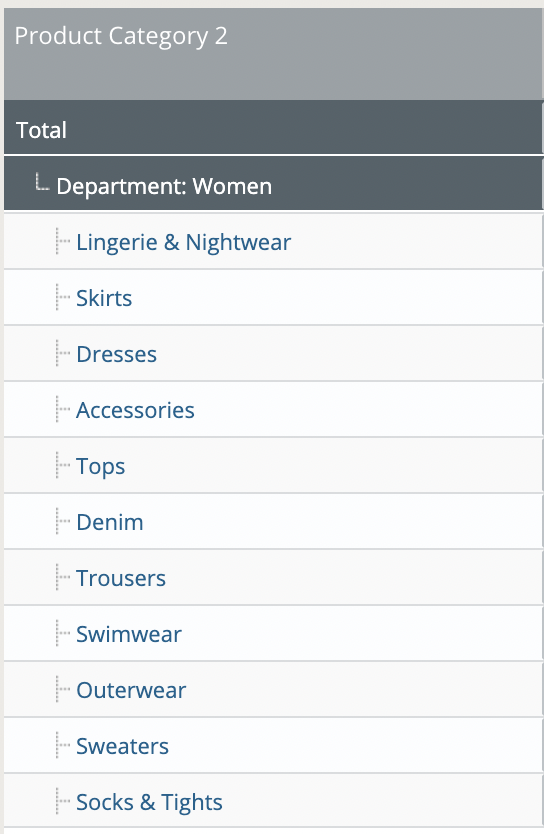
The links in the first column in the data table allow you to drill down to the next level. In most cases, DynamicAction has chosen a default drill down dimension, but you are free to change it to an alternate dimension via the breadcrumb at the top of the page at any point.
At any point, you may click the arrow next to minimize the chart and view the data table in full screen mode.
Column Drop Down Menu
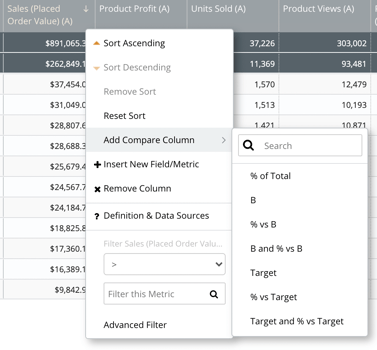
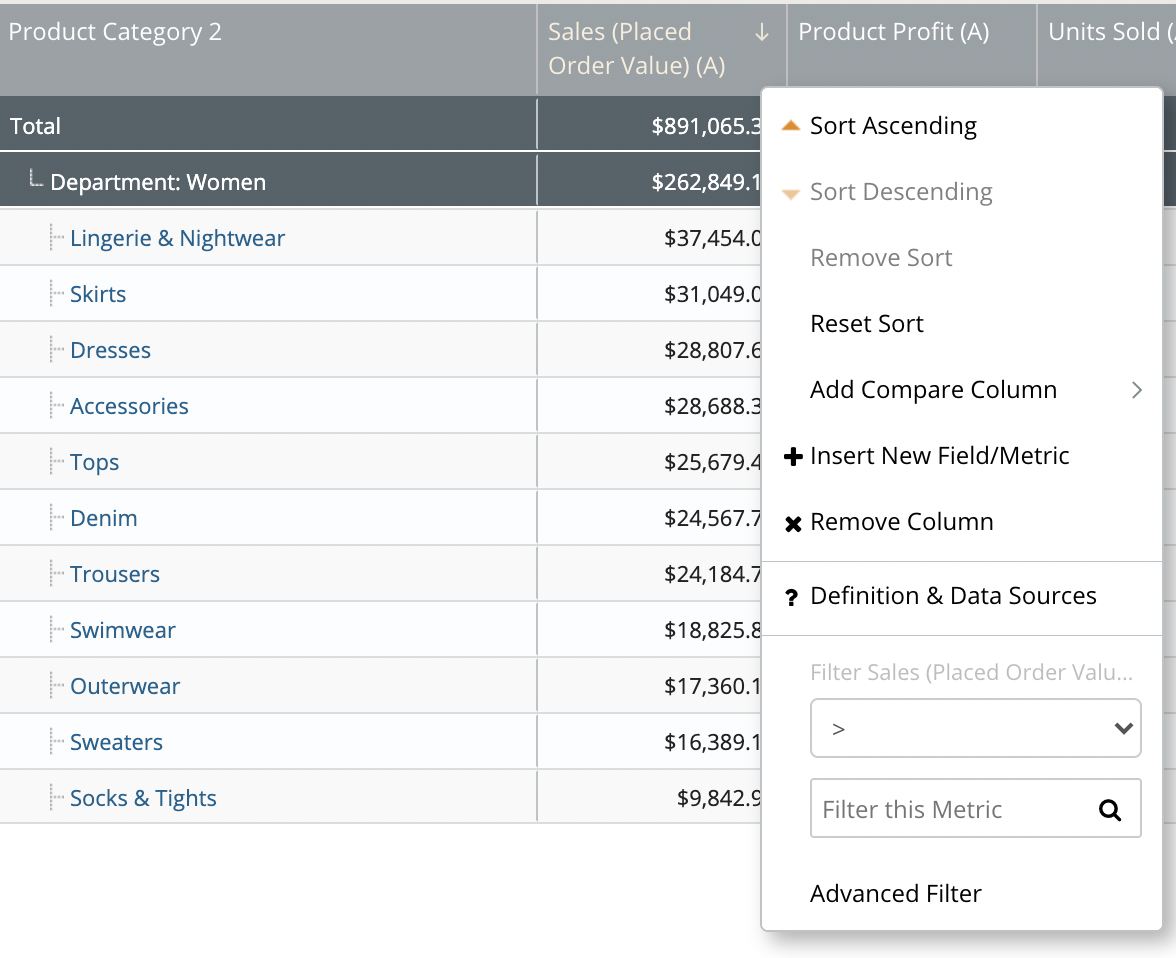
On selection of the column header drop down menu, you will find the following options:
- Sort: You may sort Ascending or Descending. If a sort has already been applied, you will have the option to remove the sort. Note: simply clicking the column header will toggle the view between sort ascending and descending. The “Reset Sort” option will remove all sorts except for the default sort for the list. You may also specify the desired sort via the Column Configuration menu accessed via the wrench icon in the toolbar.
- ? Definition and Data Source: You may view the source summary definition and data sources for the metric.
- Search: You may enter a value into the search box to perform a “contains” search on the column. For example, you might type “Ralph” for a “contains” search on the Brand column to return all rows containing “Ralph”. If searching a metric column, it performs an equals search. Click Advanced Search to apply alternative field or metric operators such as greater than or less than.
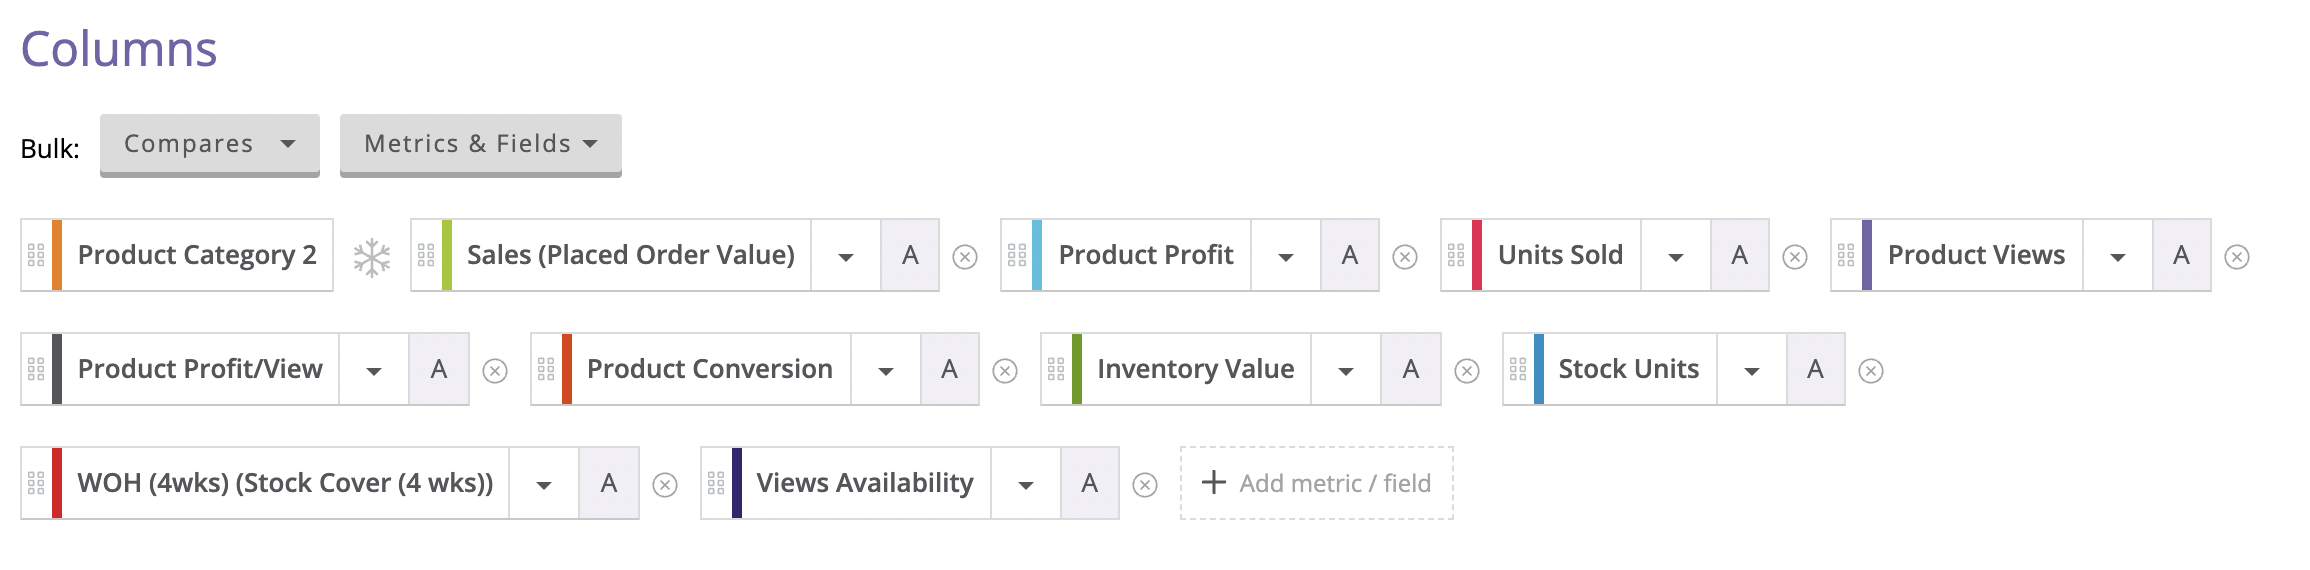
Add Fields & Metrics
Every dimension will display default metrics, but you are free to change them via the configuration menu. If the metric that you
want isn’t listed, click + Add Metric and search for your metric of choice. If the field that you want isn’t listed, click + Add Field and search for your field.
Note: Not all metrics are relevant. Not all metrics are calculable for every dimension or every dimension combination. If you see a “-“ for a particular metric, it wasn’t calculable based on the source data fed into DynamicAction.
This video demonstrates how to add metrics, look up definitions, and turn on comparisons
Comparisons
The comparison selection allows users to select comparison options for the values in the data table. Comparing to Period B will result in 3 columns per metric: a period A column, a period B column and the % change. Comparing % of Total will result in 2 columns per metric: the metric itself and a % of Total.
Going Back
As you drill down, you may go back at any point by clicking “Back” in your browser, clicking the “x” next to the last selected dimension in the breadcrumb or by clicking the “Total” rows.
Data Table Searches
You have several options search (filter) for specific a data table within a table. If you wish to perform a search, you can select Edit Grid, select your filter criteria then apply. Alternatively, you may access the search box in the column drop down menu filter area.
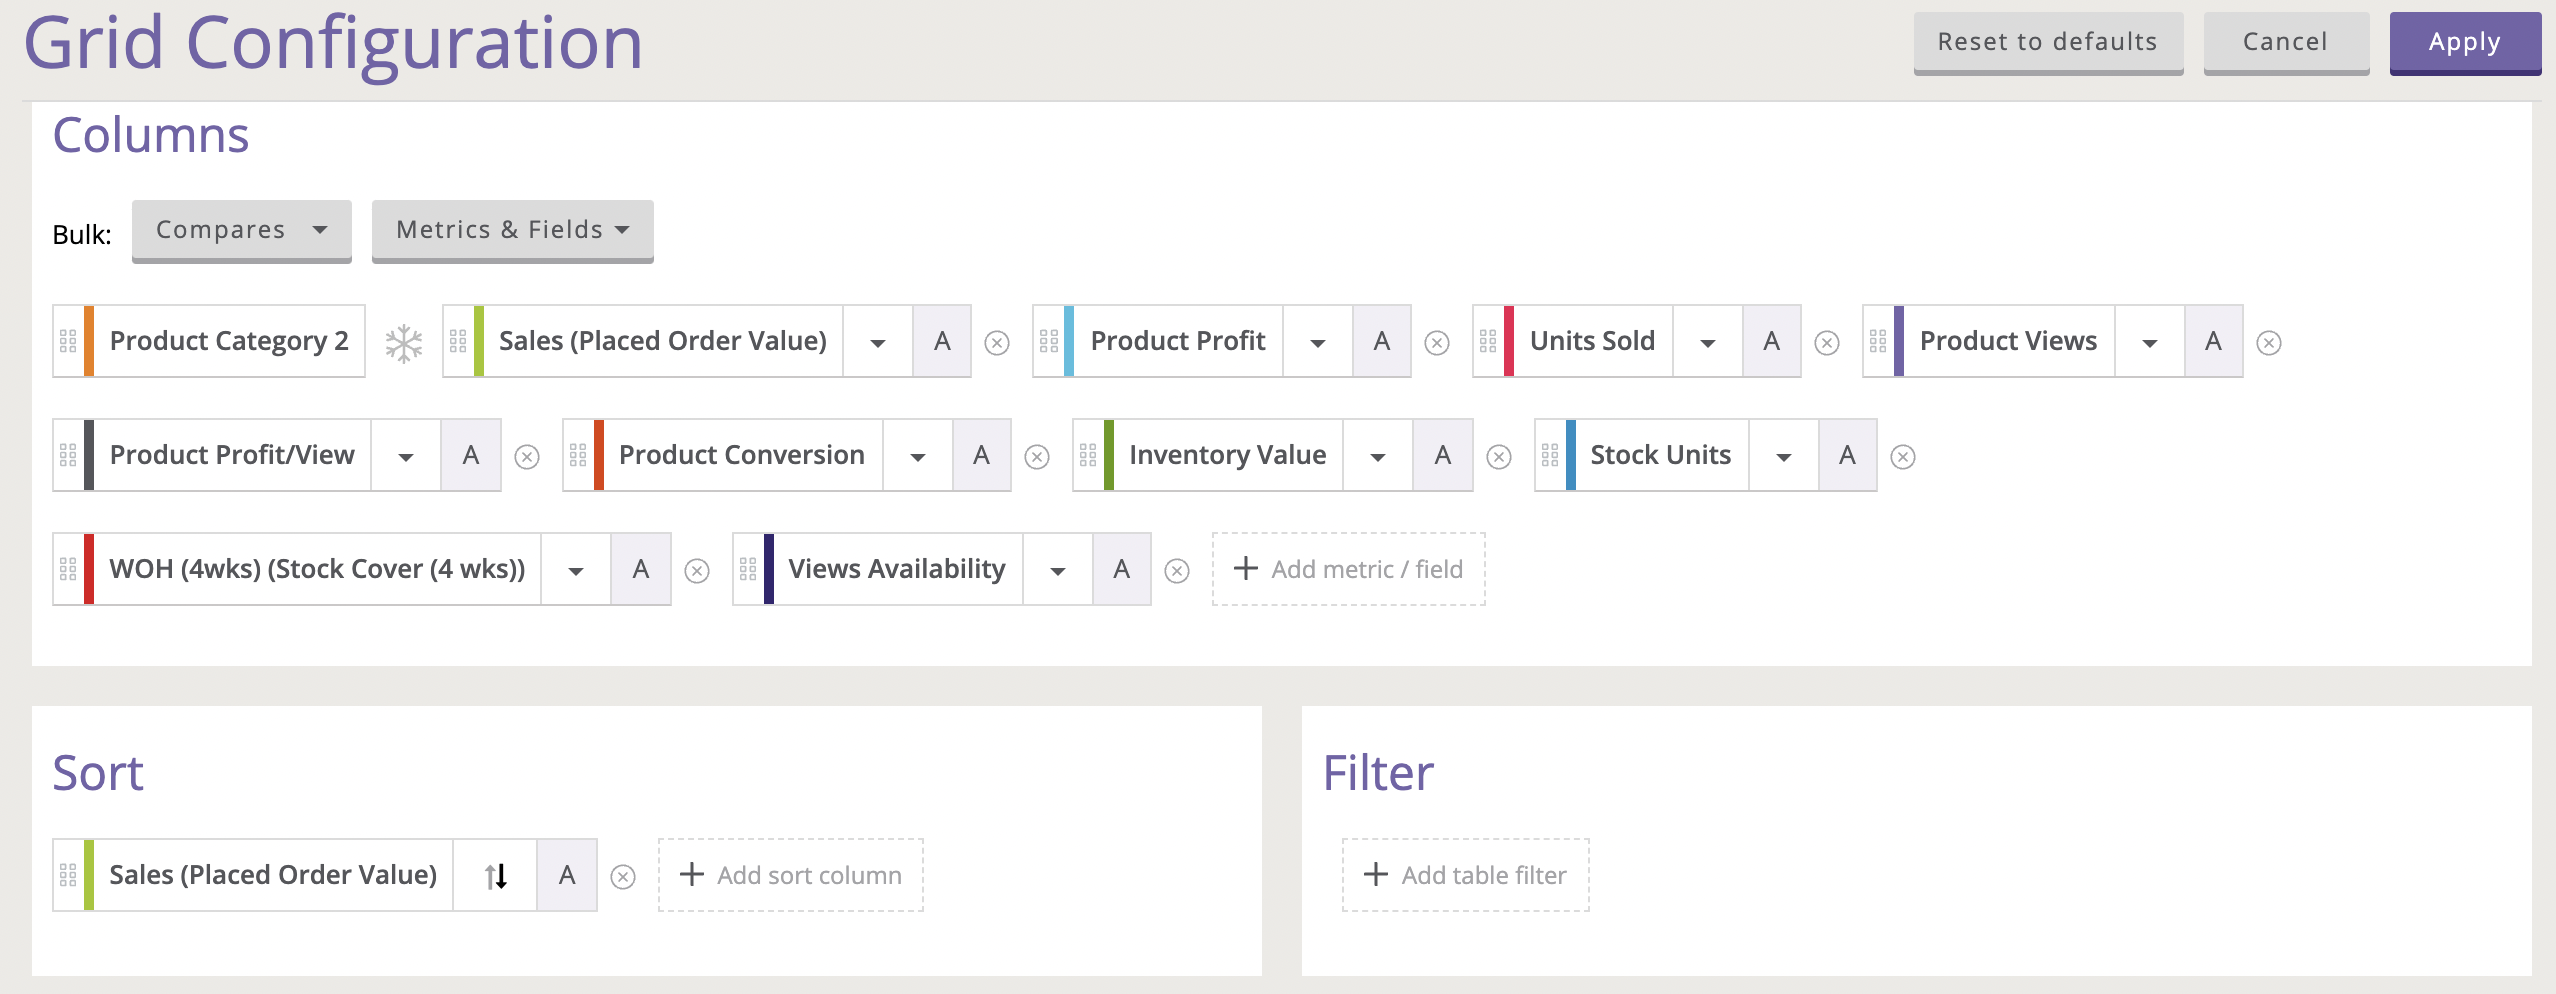
Column Re-ordering
You may re-order the columns by dragging the column header left or right. You may also drag the metrics into your desired order by access the "Edit Grid" page and configuring the order of the column headers by clicking and dragging. Note: Anything the to left of the snowflake icon will freeze the column in place, as you scroll to the right of your table those frozen columns will stay static.
Bookmark
Once you have configured a view that you expect to use repeatedly, it is recommended that you bookmark the view to provide one click return access.
Dimensions Use cases
This section of the application allow you to do a deep dive into your data by building customized reports from any of the following Dimensions; Products, Customers, Marketing, Orders, Promotions, Web Content, On-Site Search, Shipping Areas, Inventory Locations, Selling Locations, and Order Channels.
Dimensions allows you to look at your data adjust your calendar to customized ranges, which provides you the ability to see trends in your data. You can also add additional fields and metrics, and turn on comparisons to other time periods, for example compare YoY, WoW, or you can compare to the % to total to quickly compare performances of categories, marketing channels, promotions, etc. to the penetration to the business.
Filter your report to a specific list of products for example, those that you want to boost that have ample stock cover, low returns, high product profit/view or high conversion and set alerts that let you know when there are products that meet your criteria.
Products Dimension helps you identify the following:
- Profitable categories/brands/products that you can use in key zones on the website, like recommendation zones or use in marketing campaigns.
- Top selling categories/brands/products driving demand so you can ensure stock levels are adequate.
- Categories/brands/products engaging customer segments, such as your New Customers or Lapsed Customers, which you can then use in future campaigns to drive higher engagement for these segments.
- Categories/brand/products that have low stock, so you can replenish top sellers before you risk a negative customer experience on the website.
- New products and their sales, views, and stock cover.
Customer Dimension helps you identify the following:
- Customer segments driving the most demand, so you can continue the momentum with those segments and also identify customer segments that need additional engagement.
- Investigate New Customers and what emails were more successful in driving engagement.
- How the New Customer segment compares to Existing Customers.
- What Categories/brands/products converted New Customers to Repeat Customers.
Marketing Dimension helps you identify the following:
- What Marketing channels are driving demand and profit and which channel had the highest penetration.
- Where there is a high spend for paid marketing, but low return on profit.
- What campaigns within each channel were most successful.
- The impact each campaign had on customer segments, categories, brands, or products.
Promotions Dimension helps you identify the following:
- Promotions driving demand and profit.
- How a promotion impacted sales for a category/brand/product.
- How promotions engaged your customer segments, for example what promotion generated the most New Customers.
Web-Content Dimensions helps you identify the following:
- Attribute sales to web navigation categories (e.g. Lookbook, Clearance, Search, etc).
- What web navigation categories drove the most views.
On-Site Search Dimensions helps you identify the following:
- What customers are searching for and did not yield results on the site.
- Results to searches that are trending, for example, if people search “hurricane” due to summer storms, instead of having ‘0’ results, provide rain gear in their search results.