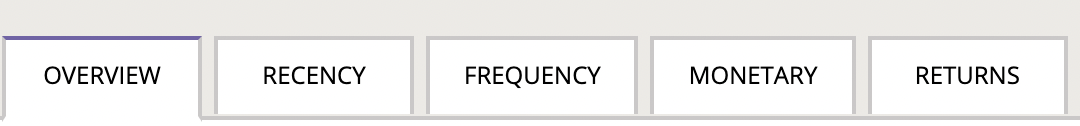
-2.png?height=120&name=EDITED%20Logo%20Dark%20-%20Color%20(1)-2.png)
Customer Opportunity Overview
The Customer Opportunities area allows you to to visualize and analyze your opportunities, the relative size of the opportunity (or problem) and to drill down and navigate them.
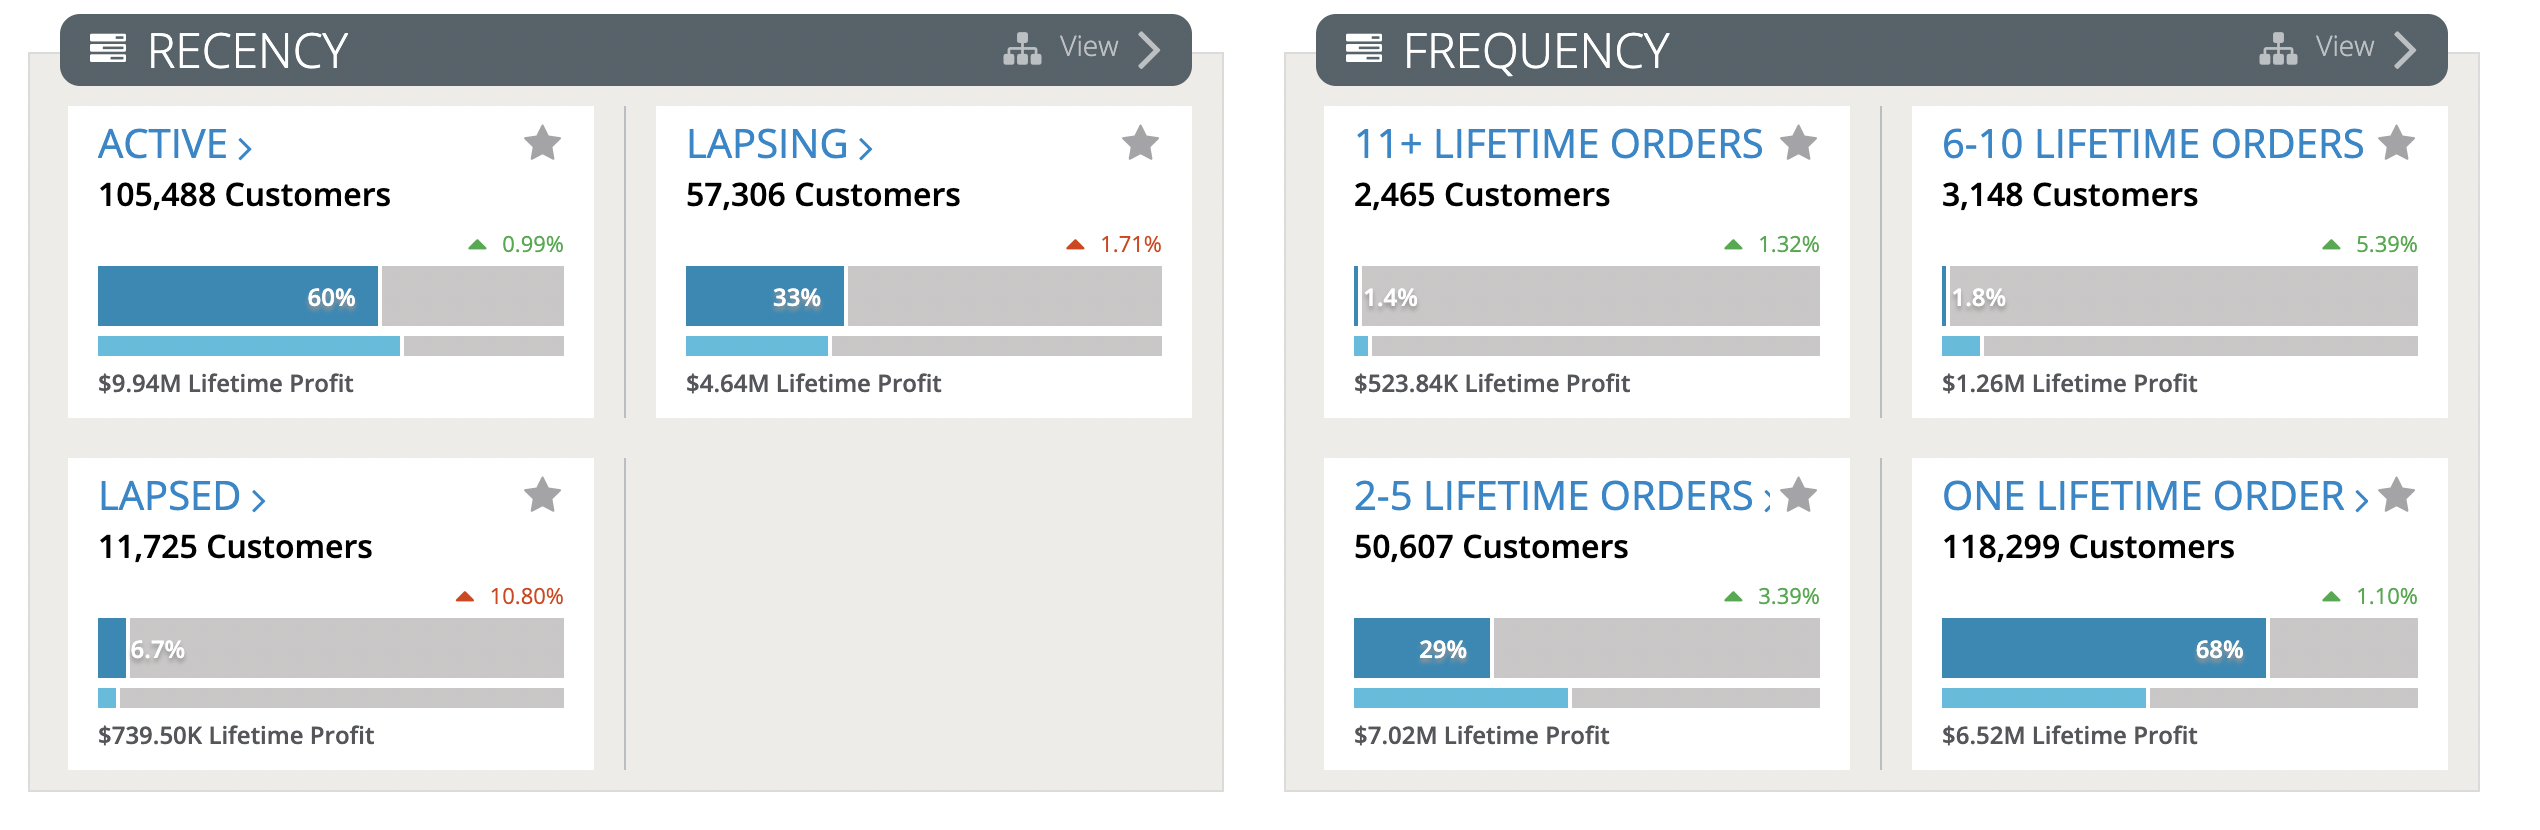
The Opportunity Overview summarizes your opportunities by 4 main customer pillars. Recency-Frequency-Monetary (RFM) plus Returns:
- Recency – The buying segment into which a customer falls based the time between their last order and the analysis date. (New Customers, 0-3 Months, 3-6 Months, etc.)
- Frequency – The buying segment into which a customer falls based on their purchase frequency (New Customers, One-Time Buyers, 2-5 Time Buyers, etc.)
- Monetary – Identify high, low and negative lifetime profit customer segments (High & Moderate, Low, and Negative Lifetime Order Profit)
- Returns – Identify customer segments by return history. (No Orders, No Returns Last 6 Months, and Returners.)
The Overview screen allows you to understand how each pillar impacts business. For instance, how many customers have placed more than 11 orders? How much profit do those customers represent? By using the drop down boxes, you can switch between the default metric and several other key overview metrics within each area. You may click any of the tabs or the “View” link from the Overview tiles to navigate to an Opportunity Tree. You also may click directly into the high-level node (such as “Lapsing”) to go directly to a node overview screen for that topic.
 Quick Filters
| To get a different look at the data, you can also apply quick filters at any point to narrow your view to a smaller set of customers. Quick filters work similarly to global filters except that they allow you to filter on specific fields as well, but limit your perspective to customer level filters. |
Customer Opportunity Trees
By clicking any of the tabs or by linking from the Overview tiles, you may navigate to a new Opportunity Tree. The trees help you to visualize DynamicAction opportunity logic, navigate to your desired segment and quickly compare metrics across nodes. Given the hierarchical structure, you can decide to drill down at any point into any node level. For example, you might want to view all customers that are “Lapsing” or you may want to go down further and only view the Lapsing customers with six or more orders. By toggling the top metric box (see inset), you can choose to view an customer count in each node or a metric (e.g. Lifetime Orders, Lifetime Profit, etc.).
Once you click into a node, you are presented with an overview page offering several ways to take further action on the segment.
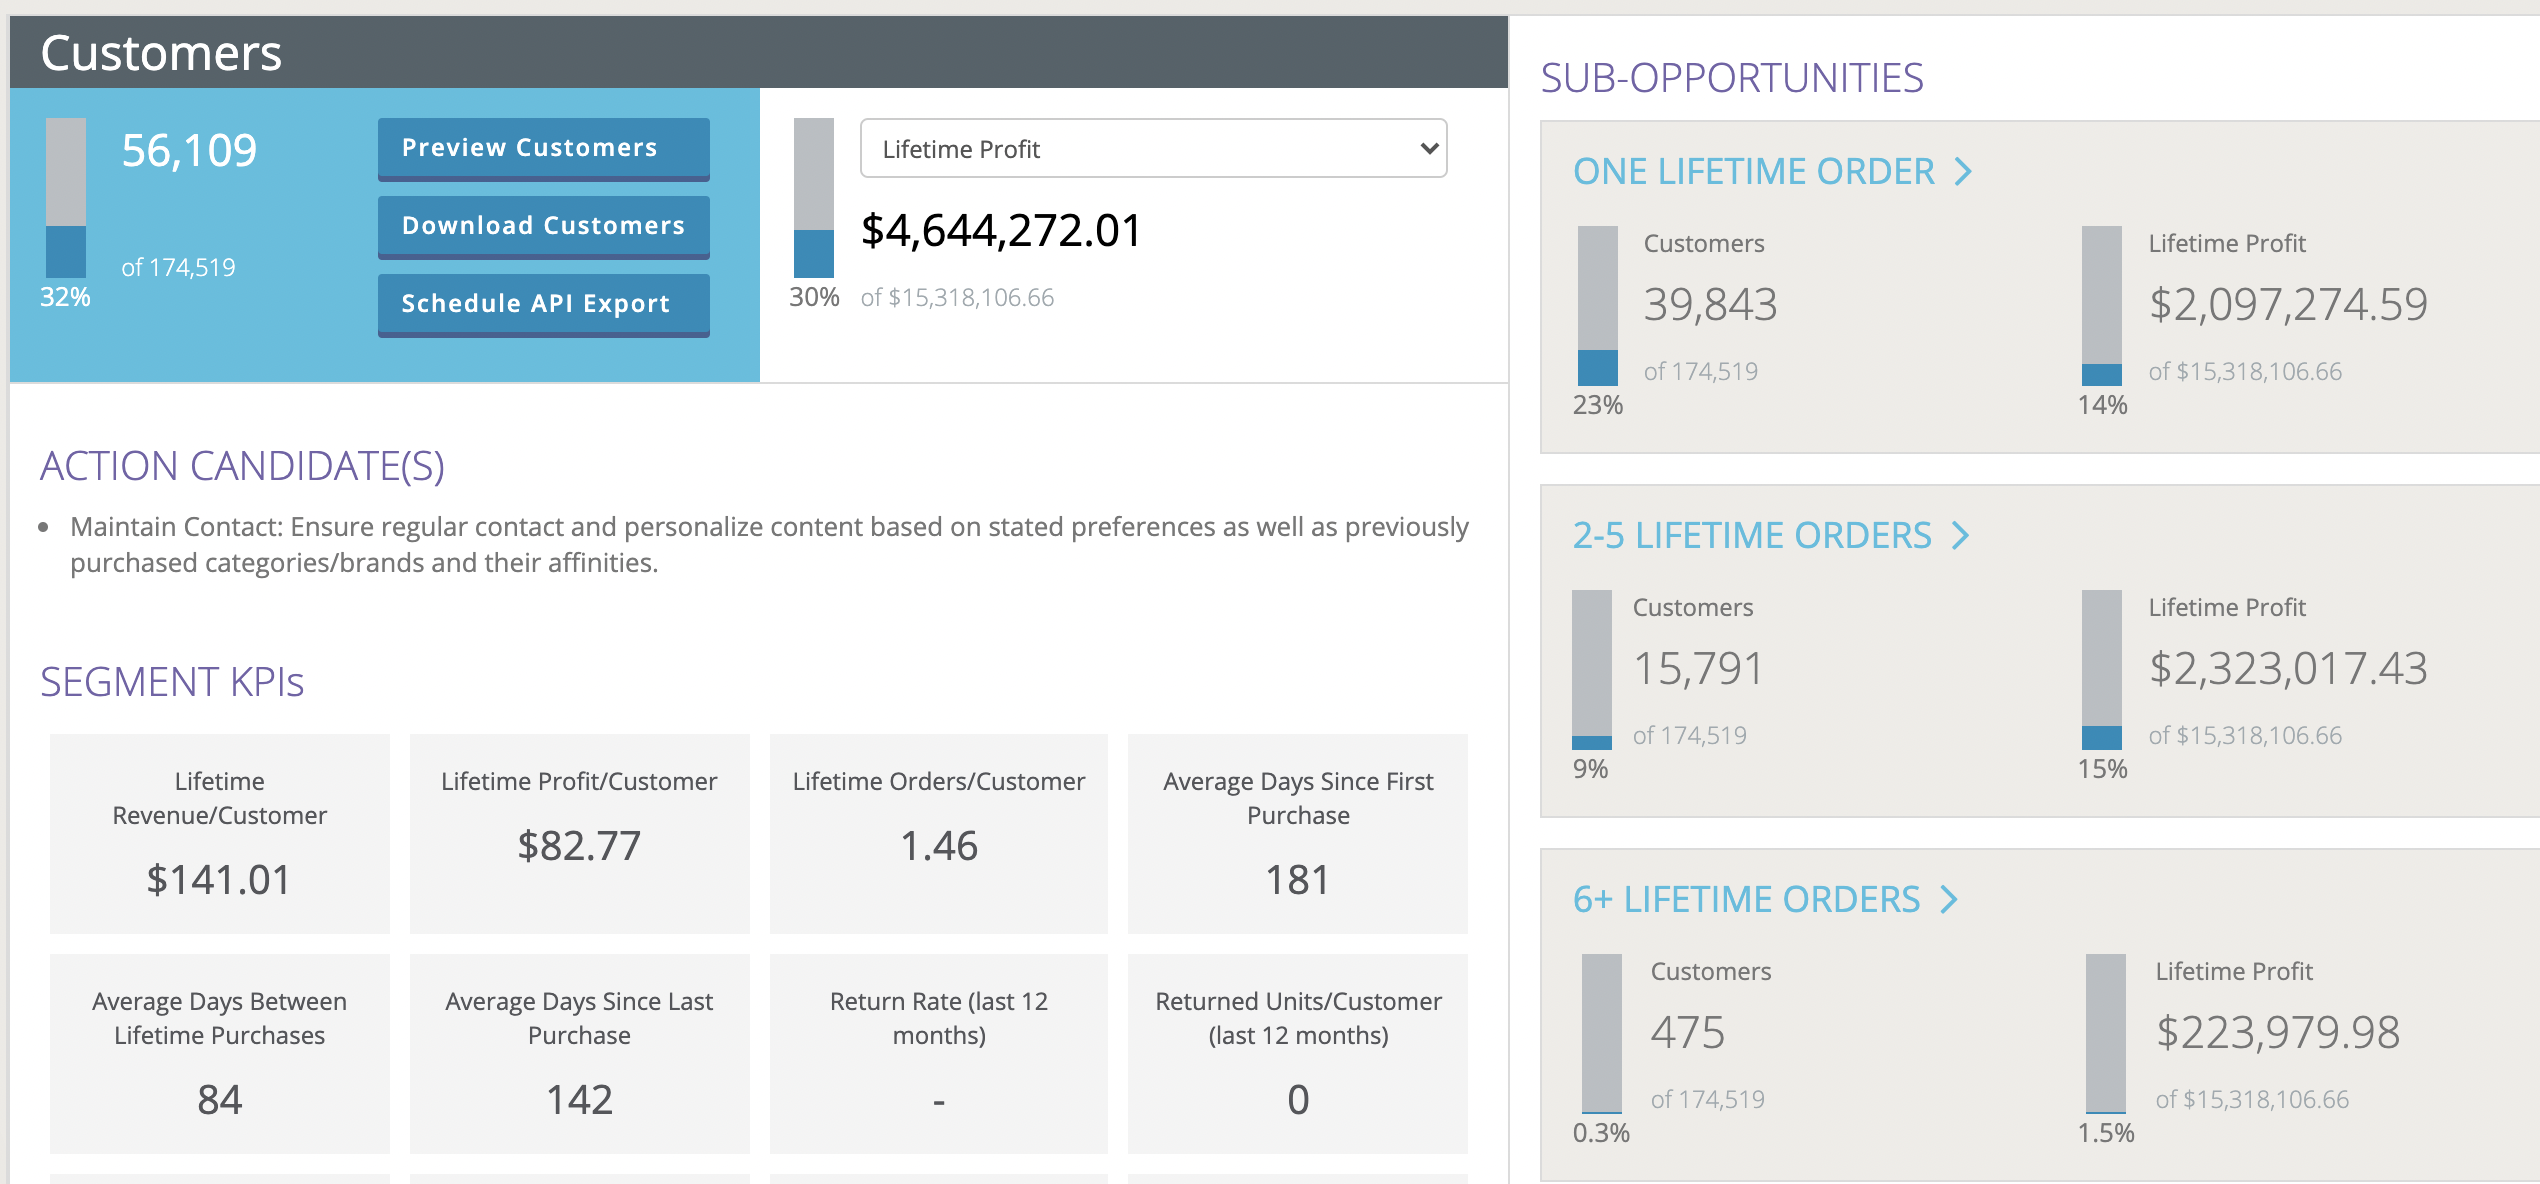
- Shows the customer count for the segment, and enables three options for looking more closely at those customers.
- Opens an overlay to show a sample set of individual customers in the segment which you can read one at a time.
- Directly download the same export as the API would generate (tab separated values file).
- Schedule an export to be created on a regular basis and be available via the APISee other summary metrics about the segment (as can be done in the tree view, using the dropdown).
- Gives you additional insight and one or more action candidates for the segment.
- Gives you all of the defining KPIs to summarize key segment metrics. In the below example, for instance, the full segment of customers who placed their last order 6-13 months ago and have had 6 or more orders average $3301.77 in revenue per customer.
- If sub-nodes are available, you will also see an option to dig deeper and navigate into sub-opportunities. For instance, clicking on Outside Repurchase Window would show you customers who placed their last order 6-13 months ago, have had 6 or more lifetime orders, and are well outside the timeframe they’d typically be expected to buy.