- Click the New Workbook button at the top right of the page.
- The first time you log in, you'll also have the option to click the New Workbook button at the center of the page.

- Next choose an existing folder from the dropdown to save your workbook.
- Click Create.

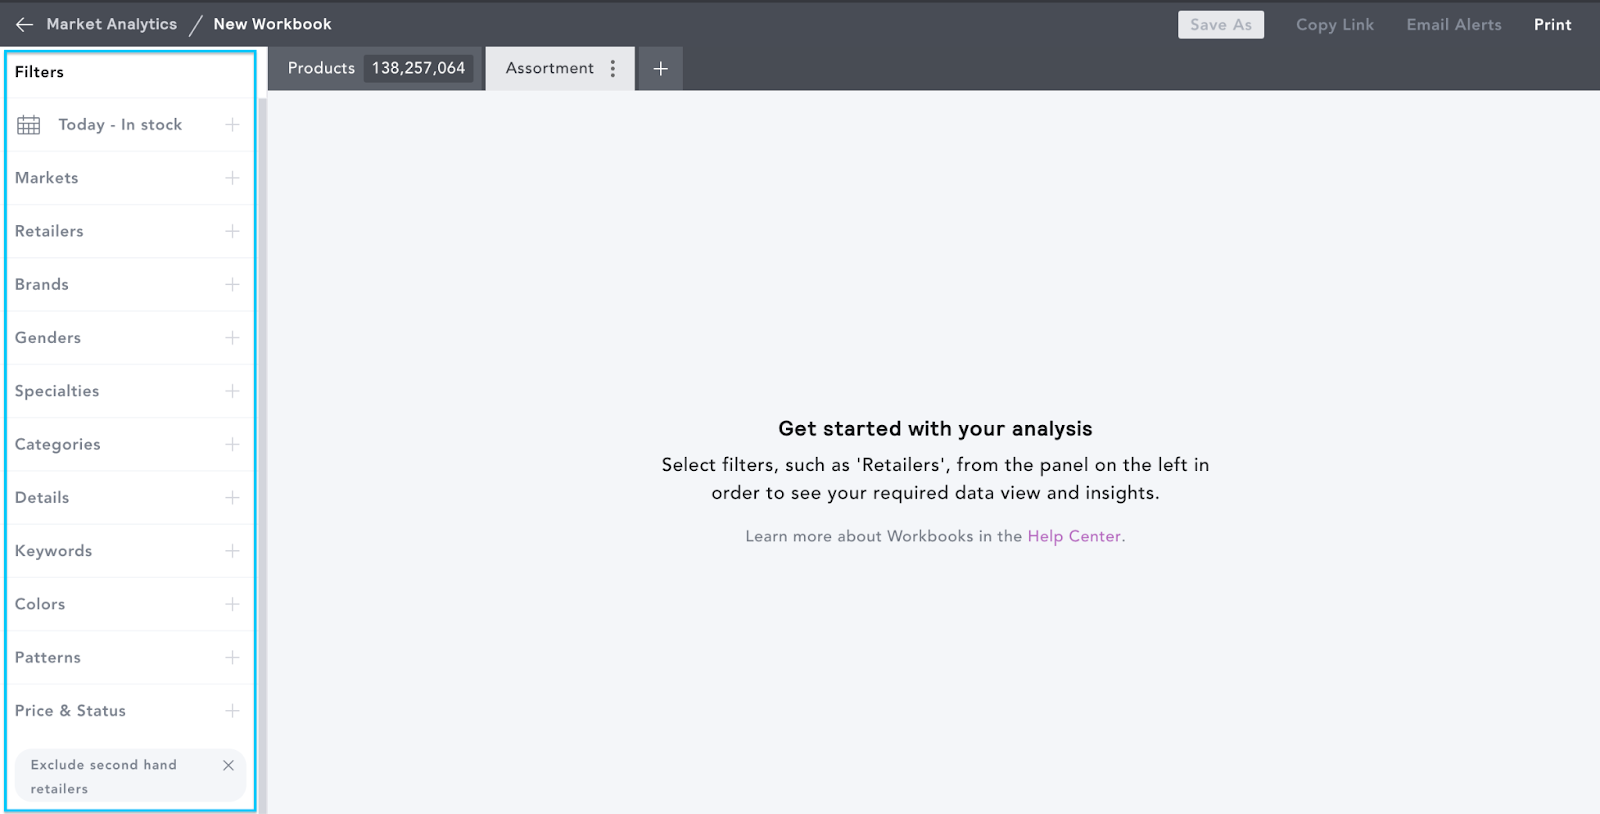
You'll be taken to a blank workbook. Here, you can add filters to populate your workbook with the products that you want to analyze. The filter panel is on the left-hand side of the page.
See Market: Workbook Filter Panel Overview for a breakdown of all of the available filters.
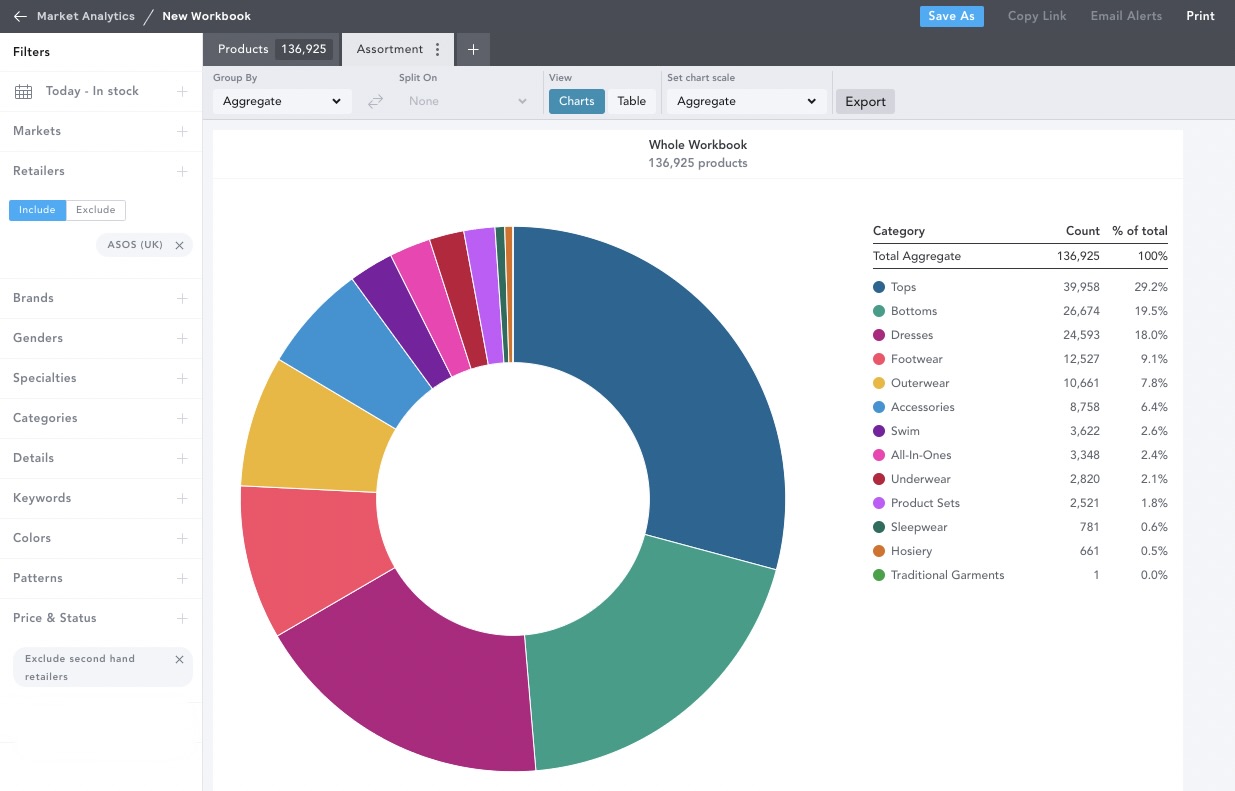
When you add filters to a new workbook, an assortment chart of your dataset is the default view.
Creating Tabbed Workbooks For Multiple Views Of Your Dataset
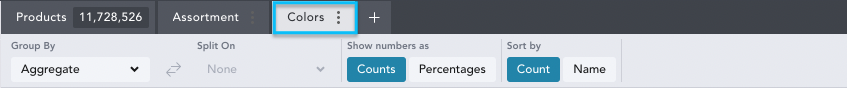
You are able to have multiple analysis charts saved within one workbook. This allows you to visualize different views of your selected dataset. For example, you could answer 'how are my prices benchmarked against competitors' in one tab and 'how does my discounting depth compare' in another. The filters in the left filter panel of your workbook apply to all tabs. However, the chart controls at the top of each tab are tab-specific. You can create up to five tabs per workbook.
When you add filters to a new workbook, an assortment chart of your dataset will automatically be generated. If you would like to view a different analysis type or create another assortment chart, select the + symbol tab in the top bar.

You’ll be presented with all the Analysis Types to select from.
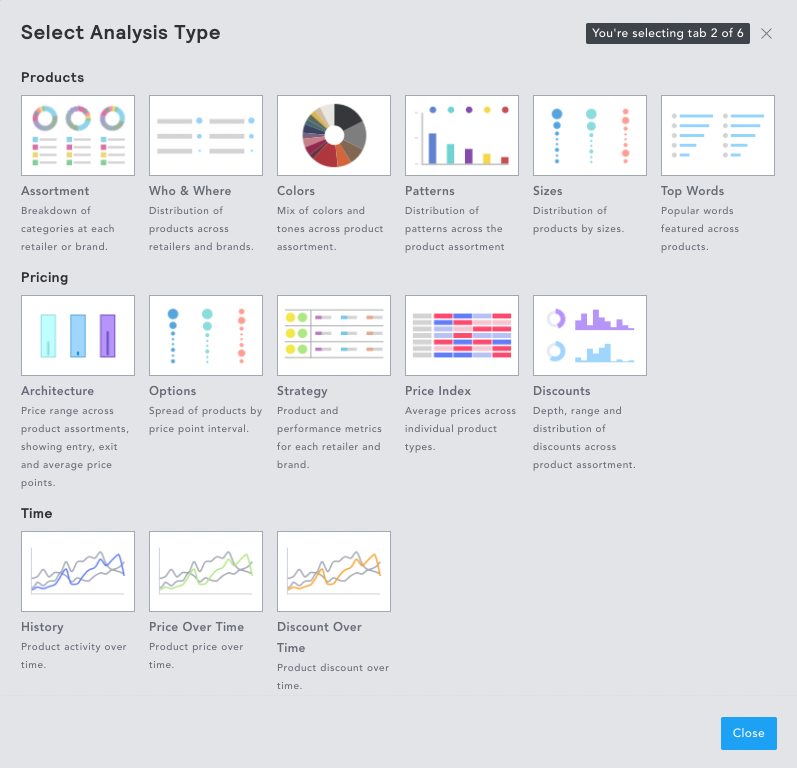
Once you’ve selected your analysis type, it will appear next to your existing tabs.
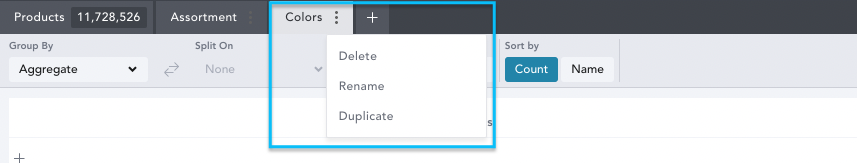
Clicking the three dots on a tab will allow you to Delete, Rename or Duplicate the tab.
You can also drag the tabs to your preferred order.
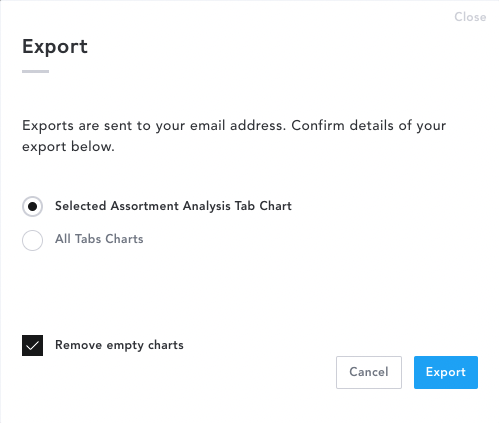
Raw chart data from charts and tables can be exported and emailed to you using the Export button. Ensure your workbook is saved and then click Export at the top of your chart controls.
You will have the option to export your current tab or all tabs.
Please note that Color and Pattern analysis can’t be exported.