Market: How Do I Compare Different Time Periods Side By Side?
Compare different points in time side-by-side in your analysis
If you want to compare ranges across different points in time - for instance, last year's intake of swimwear in June versus this year's - you can do so using our Chart Controls.
When adding in historical date ranges, it is important to remember that you are looking at products that were in stock over a period of time. Since that period, products may have sold out. Therefore, to see everything that was in stock during your selected period of time, you need to have both out of stock AND in stock products selected.
Select the calendar icon at the top of the filter panel. Select Out of Stock to include products that may have sold out since your selected timeframe. Keep In Stock checked to include products that were available during your selected timeframe and are still available today.
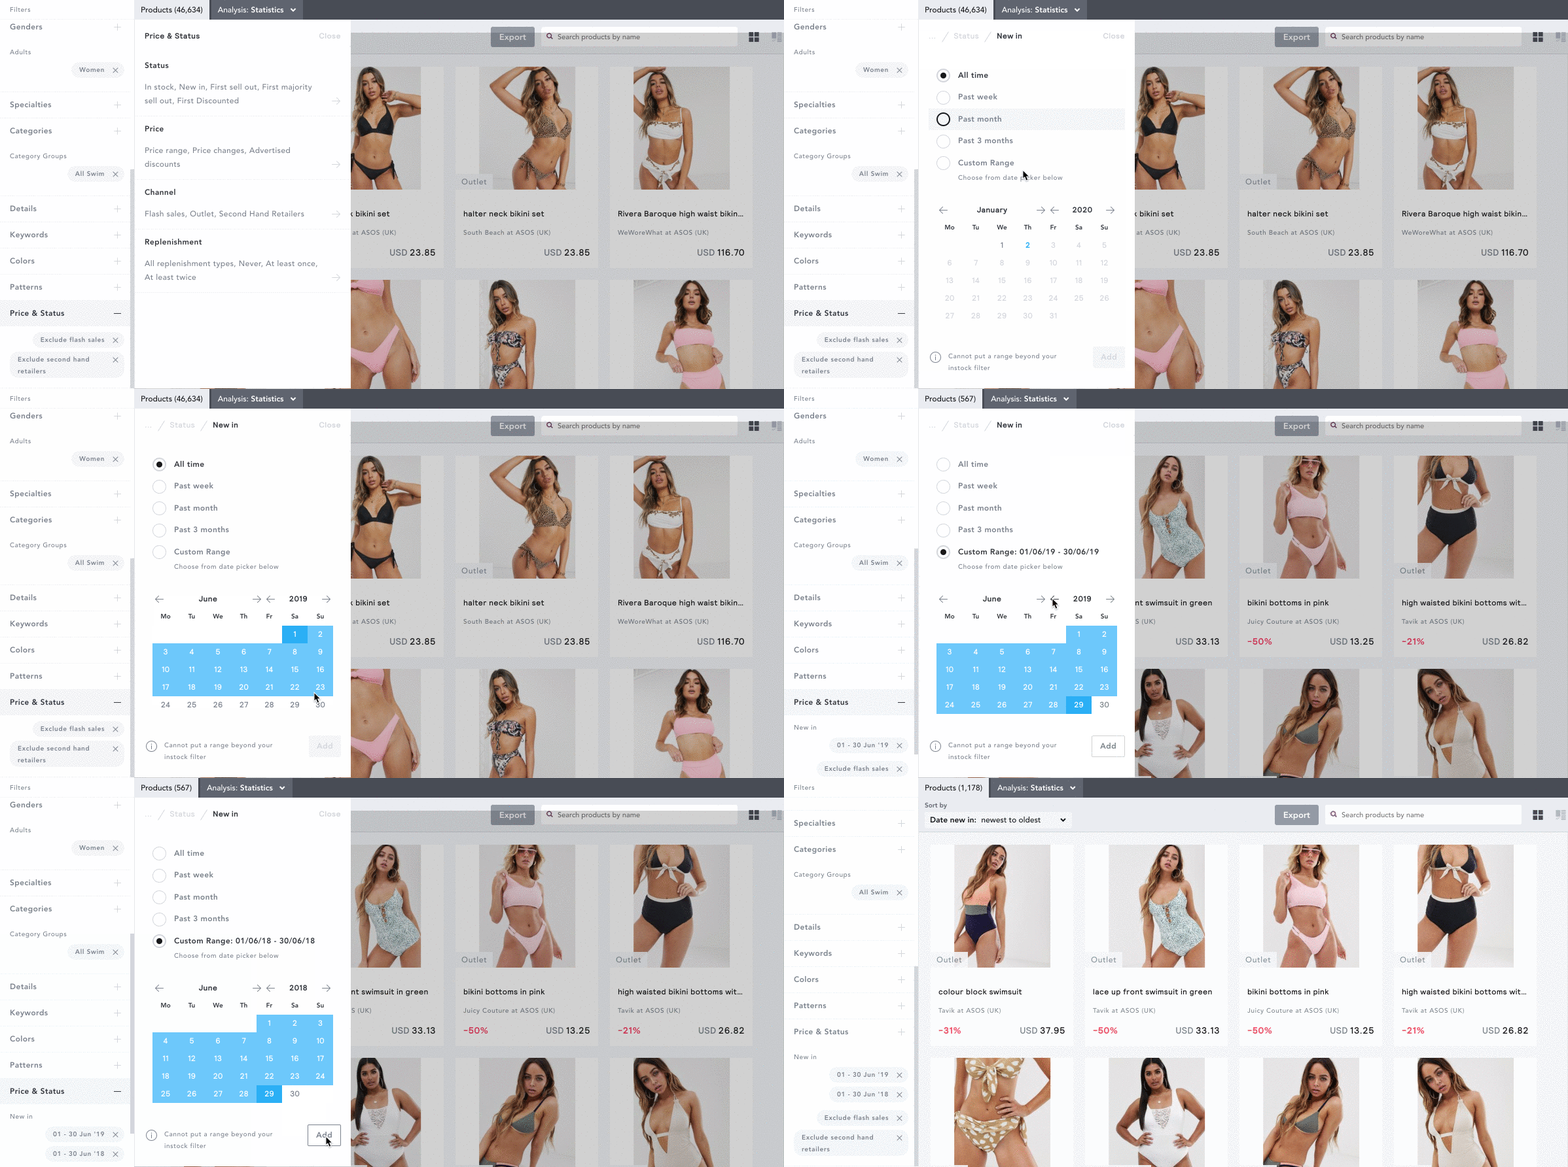
Next, you'll need to add the date ranges you want to compare using the Price & Status filter > Status, and choosing from the following options:
- New In
- First Sell Out
- First Majority Sell Out
- First Discounted
- In Stock
Click through on each to choose your dates. Select from the past week, past month, past 3 months or Custom Range to select a specific time frame using the date picker. When using Custom Range, don't forget to click Add after each time frame you've specified to add it to your filter panel.

If you do not have access to the Calendar filter at the top of your filter panel you'll need to add the date ranges you want to compare using the Date & Timeline filter, and choosing from the following options:
- New In
- First Sell Out
- First Majority Sell Out
- First Discounted
- In Stock
Click through on each to choose your dates. Select from the past week, past month, past 3 months or Custom Range to select a specific time frame using the date picker. When using Custom Range, don't forget to click Add after each time frame you've specified to add it to your filters.
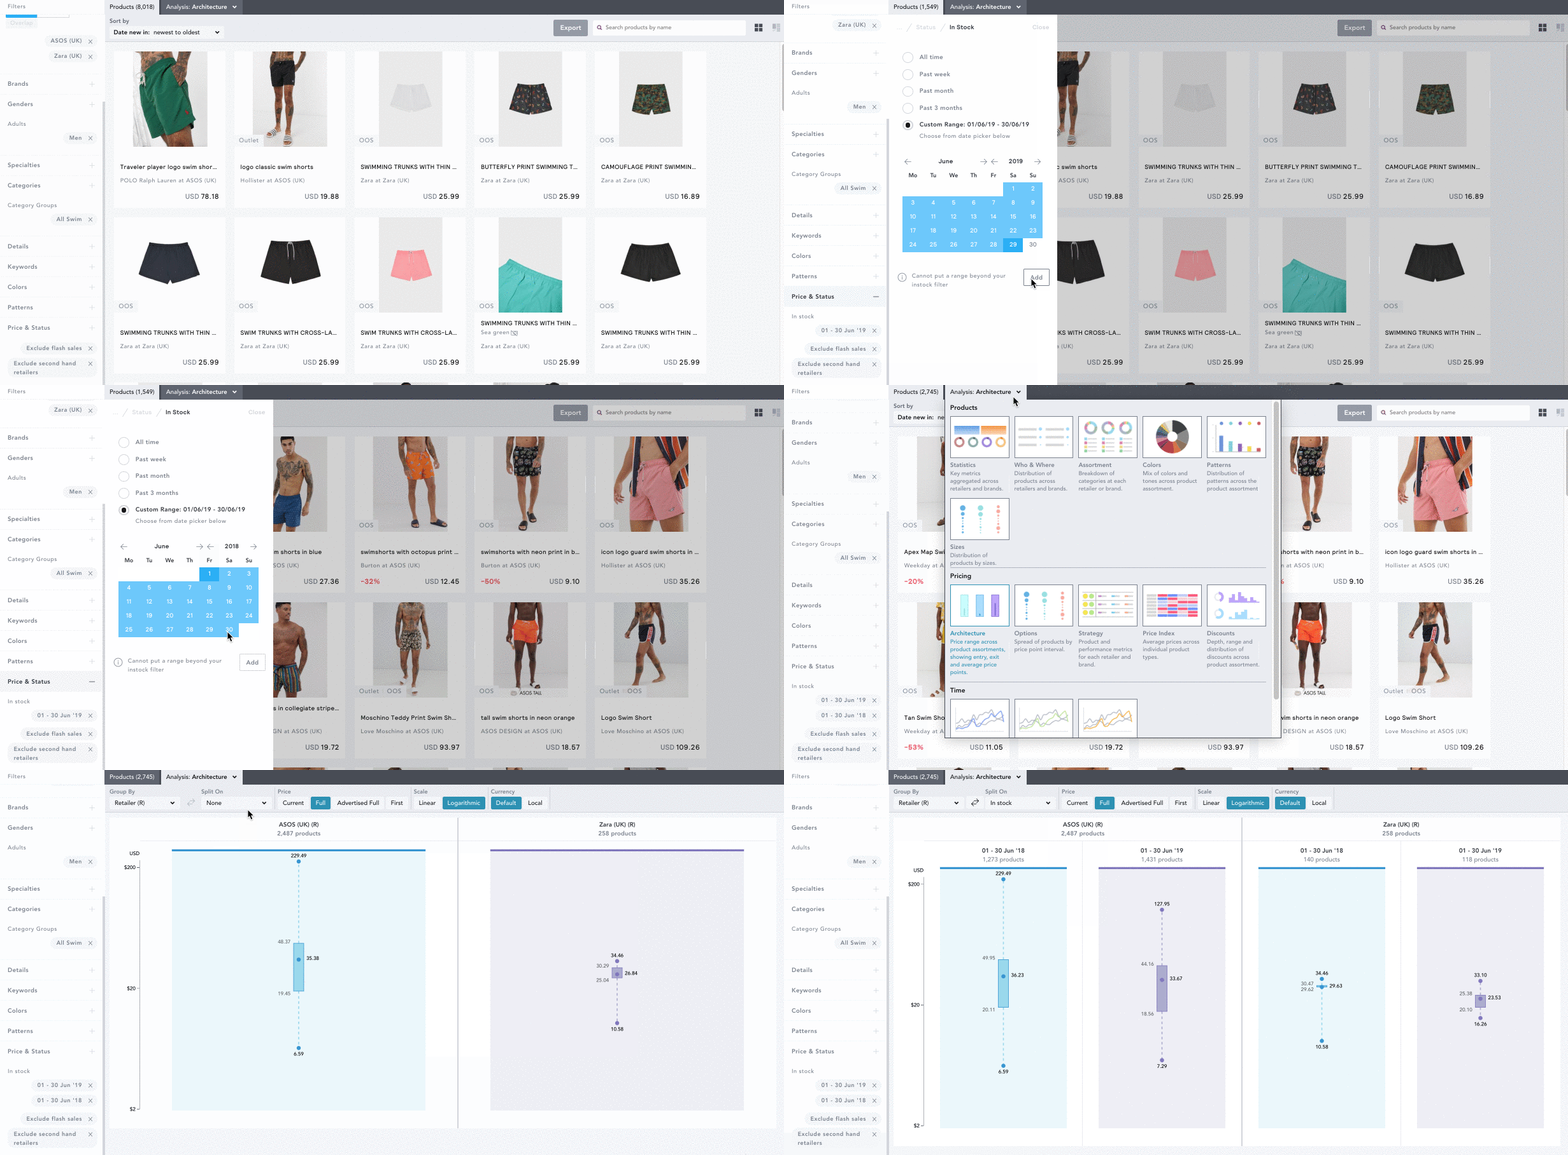
Once you have multiple time frames selected, you can compare them side-by-side in any of the following Analysis tools:
- Assortment
- Colors
- Patterns
- Architecture
- Options
- Strategy
- Price Index
- Discounts
- History
Note: You can only compare time frames from the same metric (e.g. New In June 1st 2018 vs New In - June 1st 2019) against each other, so you must have at least two of the same metrics selected to be able to compare them.
Using the Group By and Split On drop downs at the top of your dashboard, you can then select how to see the data in your workbook.
In the example below, we're comparing In Stock men's swimwear from ASOS and Zara in the UK for the May 2018 and 2019 and how their price architecture has changed.
