-2.png?height=120&name=EDITED%20Logo%20Dark%20-%20Color%20(1)-2.png)
Chart Controls will help you display the data within your workbook in a number of different ways. You will find them at the top of your workbook when you are in the following analysis tools:
- Assortment
- Colors
- Patterns
- Architecture
- Options
- Strategy
- Price Index
- Discounts
- History
- Price Over Time
- Discount Over Time
See below for an outline of chart control functionality.
Group By and Split On
Use the ' Group By' and 'Split On' drop downs to see the data in your workbook by-
- Aggregate: see all the products in your workbook represented
- Region: see the data by each region selected in your workbook
- Segment: see the data per market segment selected in your workbook
- Retailer (R): see the data per retailer selected in your workbook
- Brand (B): see the data grouped by the brands selected in your workbook
- Gender: see the data per gender selected in your workbook
- Category: see the data per category selected in your workbook
- Product Details: see the data per product detail selected in your workbook
- Keywords: see the data per keyword grouping in your workbook
- Patterns: see the data per pattern selected in your workbook
- New In: see the data on new in products in your workbook per time frame selected
- First Sell Out: see the data on first sell out of products in your workbook per time frame selected
- First Discounted: see the data on first discount of products in your workbook per time frame selected
- In Stock: see the data on in stock products in your workbook per time frame selected
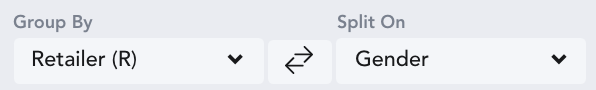
You will find this option within Colors, Architecture, Options, Strategy, Price Index, Discounts and History. In the video below, the data is being grouped by retailer and then split on gender -
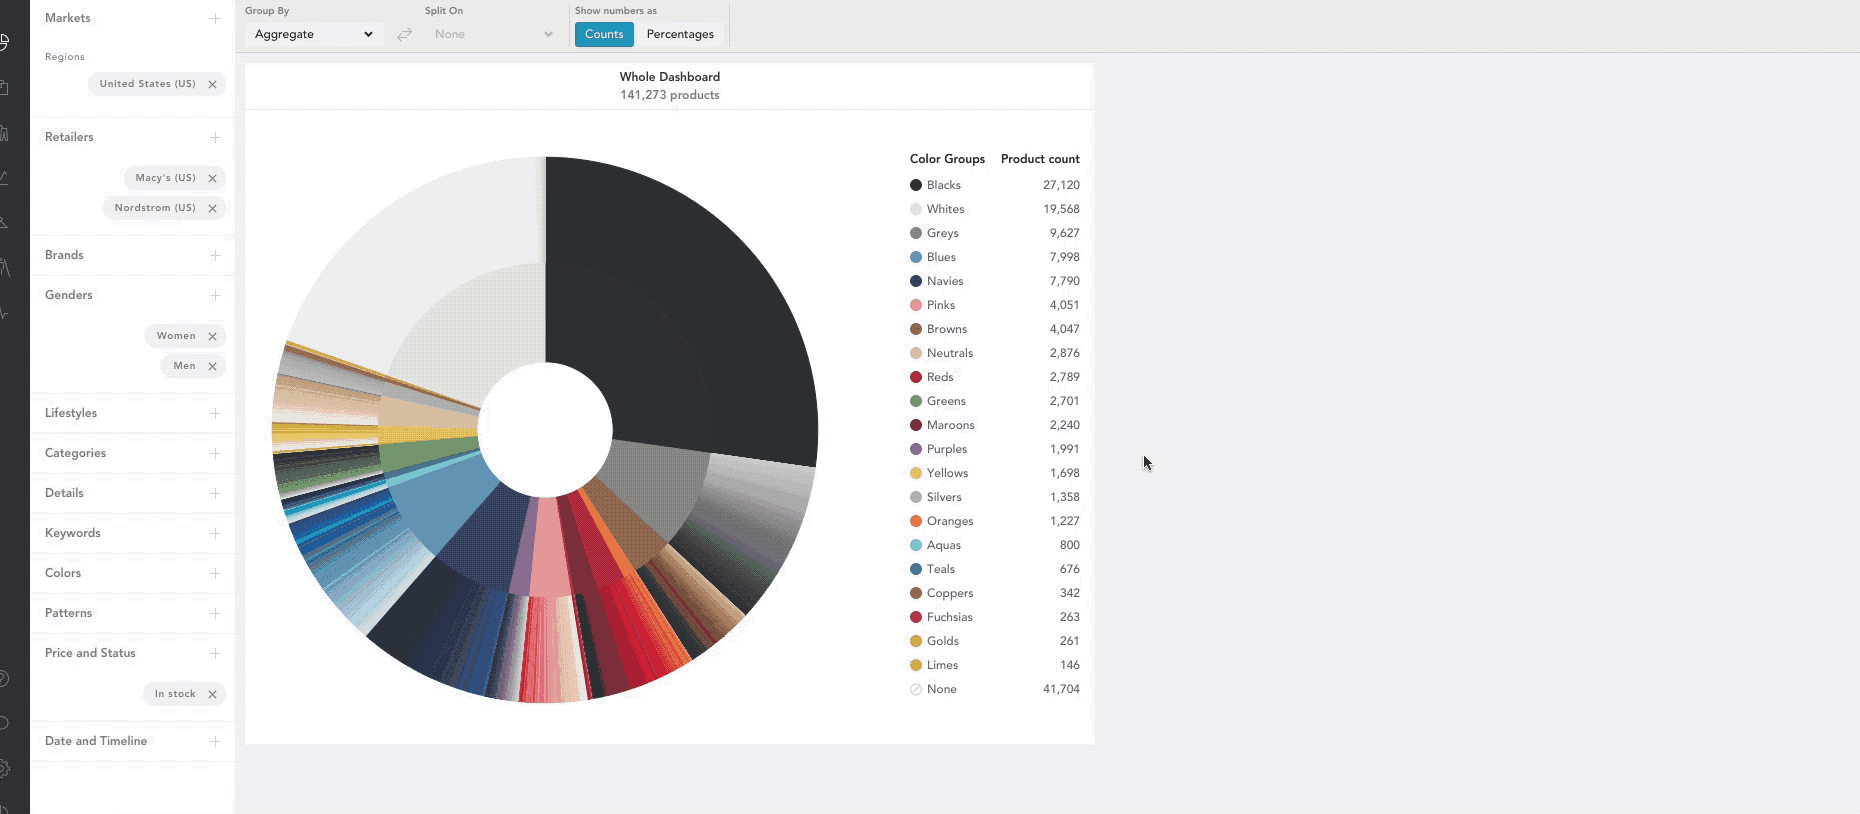
The criteria you can choose to group by and split on depends on the filters you have applied in your workbook. Above you can see that the only options to select are Aggregate, Retailer and Gender because those are the only filters that have been selected in the workbook.
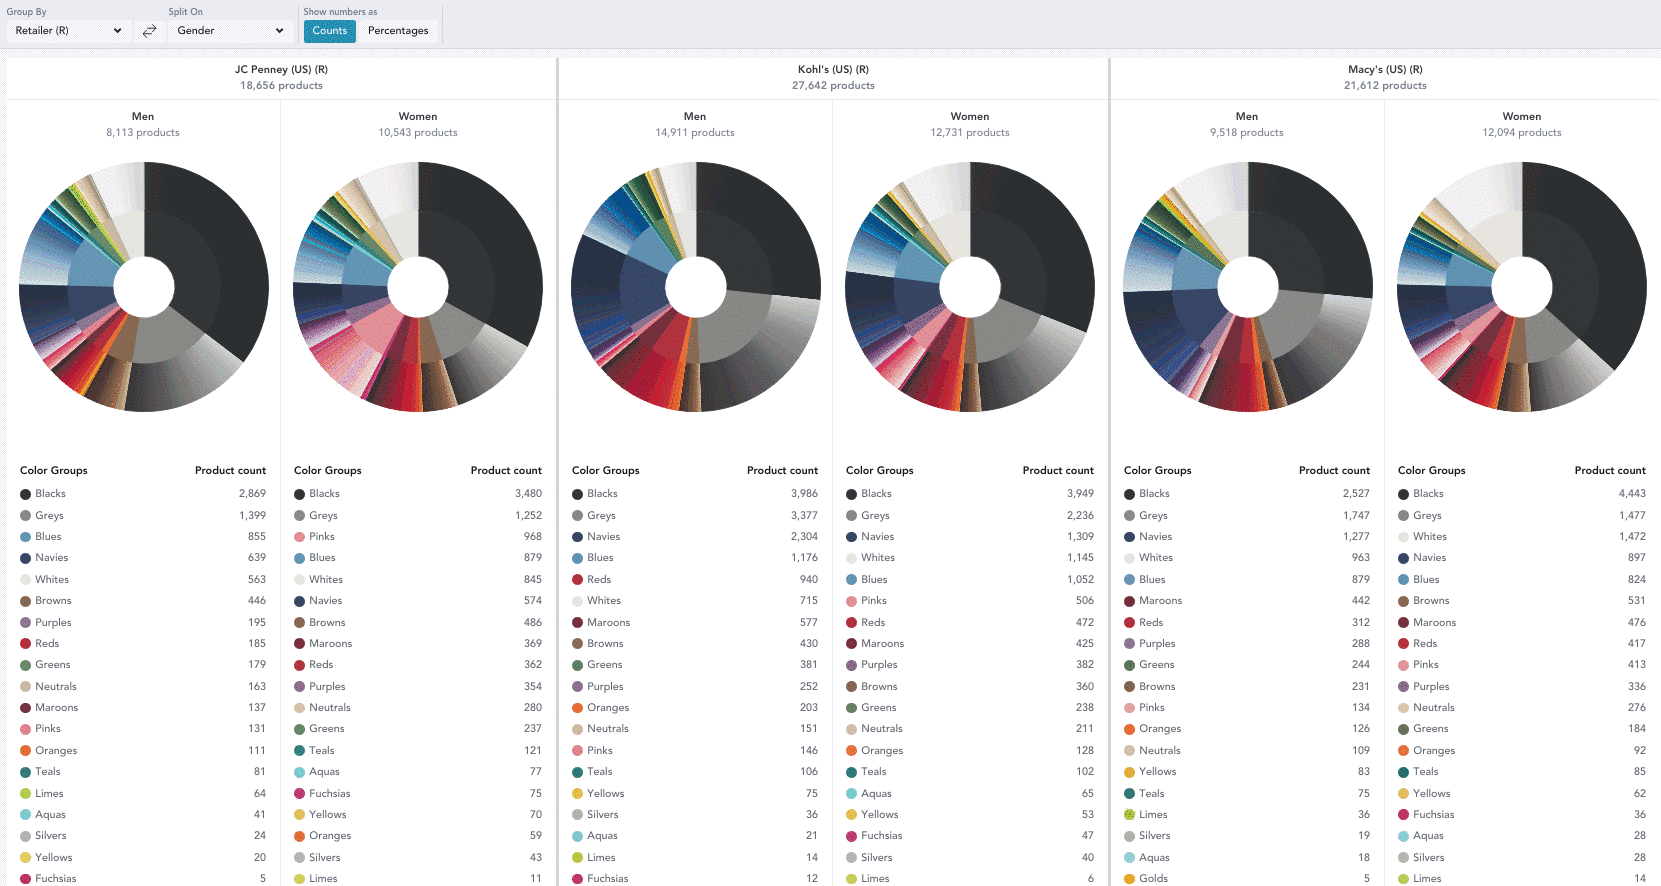
The double arrows will let you quickly switch your data. In the example below, the workbook that was originally grouped by retailer and split on gender is now being switched around to be grouped by gender and split on retailer -
Group And Split Using Keywords
When you'd like to see how the market is split based on the keywords you're using in your workbook you need to group them together so that similar words are in the same text box so if you want to compare spots vs stripes, you want your inclusions to look like this -
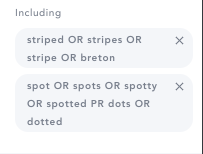
rather than this -
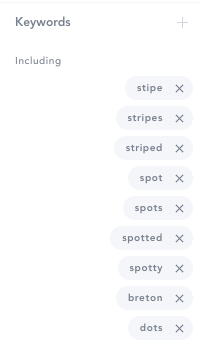
Currently EDITED is able to group by and split on keywords that are entered into the 'including' and 'excluding' fields. This function is not available within the 'more options' function.
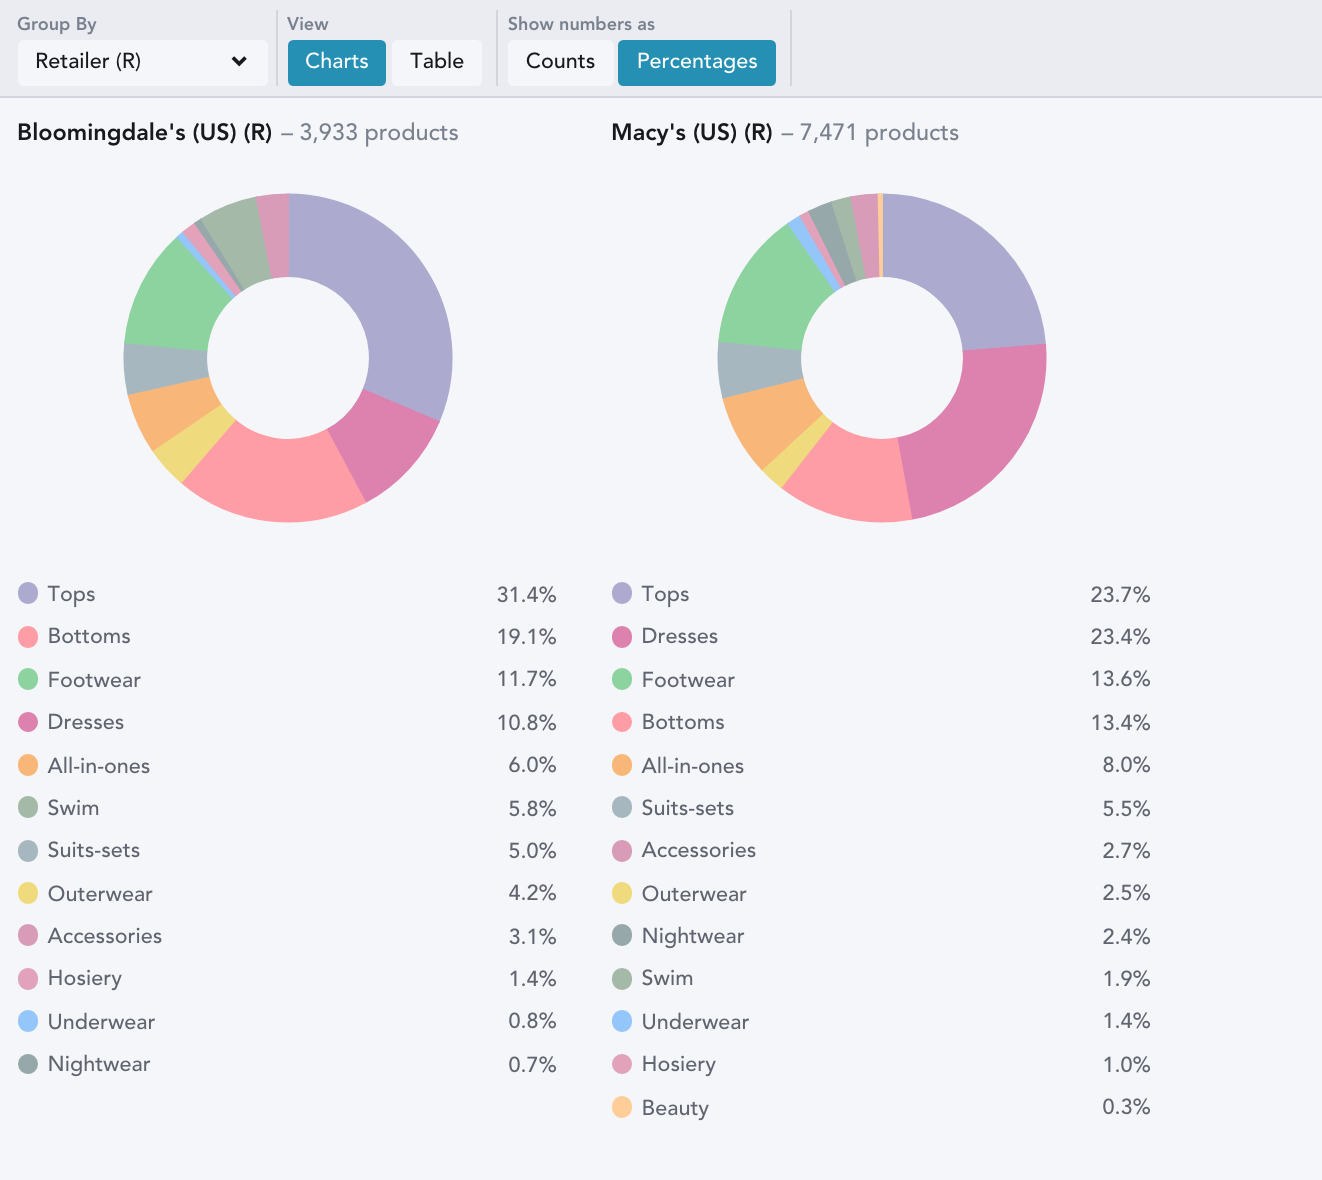
Show numbers as Counts/Percentages
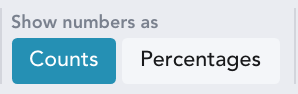
This chart control allows you view your data by the product counts or as a percentage mix of how your products are grouped within your workbook. You can use this button in Assortment, Color and Options.
In the example below, the data has been grouped by retailer and shown as a percentage. 31.4% of the 3933 Bloomingdale's products in this workbook are Tops -
View products by their Current/Full/Advertised Full/First price
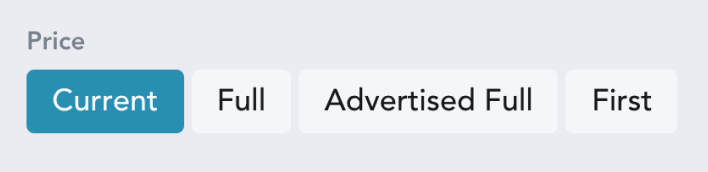
This set of buttons allows you to analyze the products within your workbook based on their -
- Current Price - The selling price of a product’s cheapest SKU, at the time it was last tracked
- Full Price - The highest selling price that EDITED has ever seen the product at. If the price of a product increases from that when it was first seen, this will become the new 'full price'
- Advertised Full Price - The highest advertised price that EDITED has ever see the product at.
- First Price - The selling price of the product’s cheapest SKU, the first time the product was seen on the retailer’s site
You'll see this option within Architecture, Options, Strategy and Price Index.