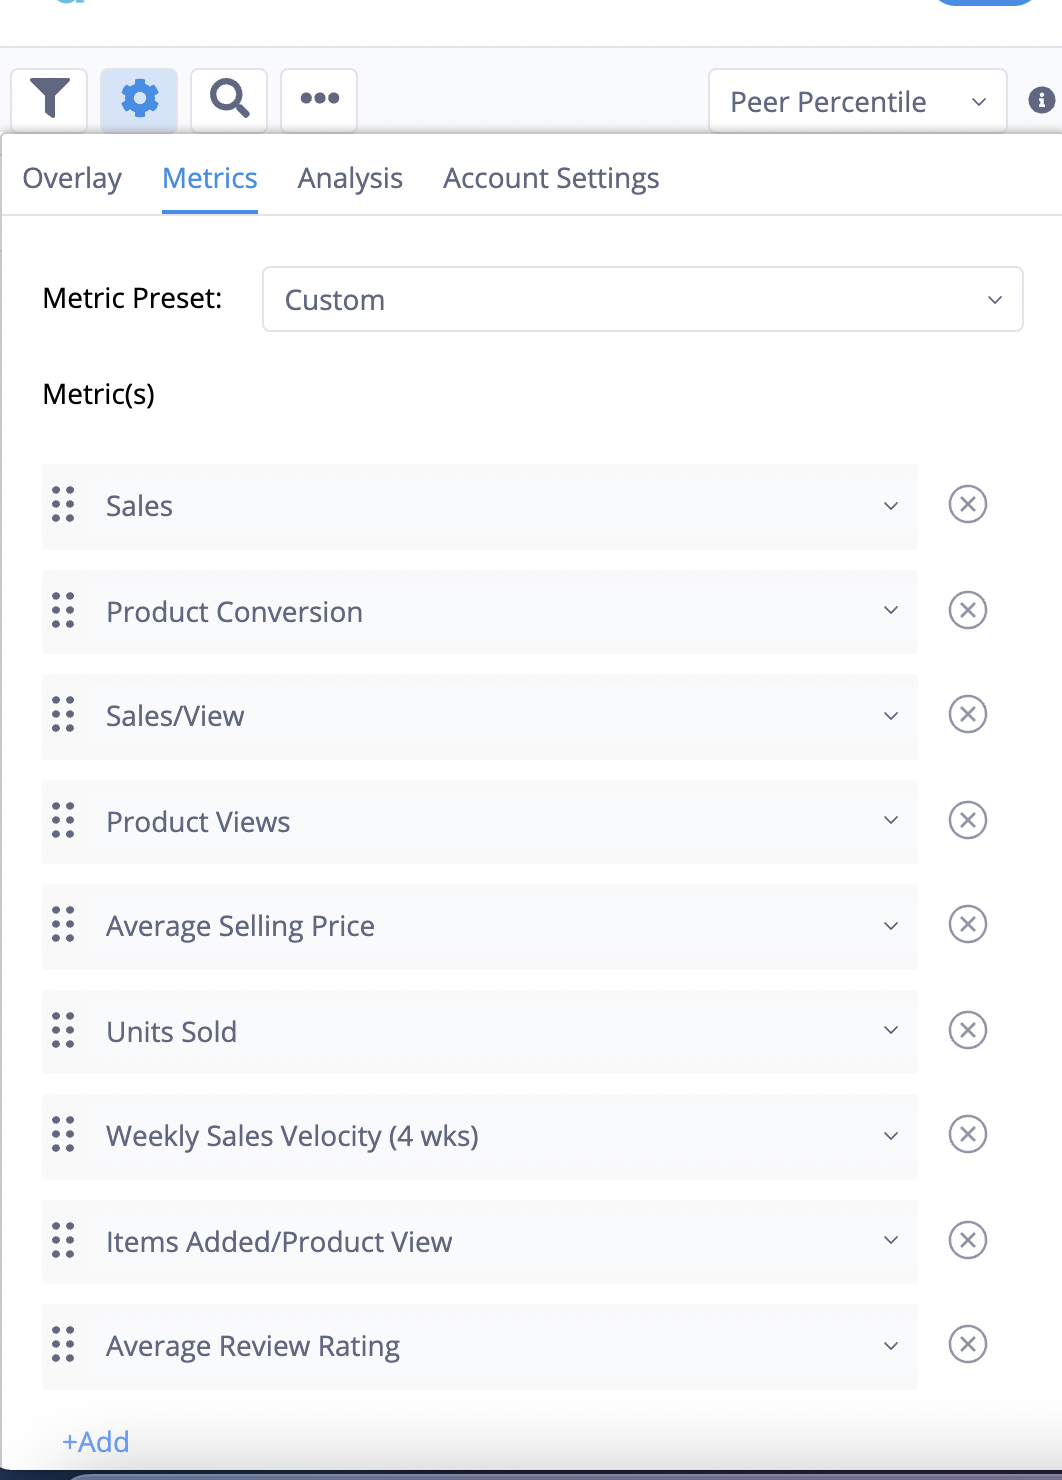
 The Metrics configuration tab provides access to DynamicView’s list of 200+ supported metrics that can be custom curated by each individual user for display in the sidebar when analyzing a specific product. By clicking the cog icon and loading the Metrics tab, you will be able to add, remove and reorder the metrics to be displayed. Similar to the Overlay configuration interface, click the +Add button to display additional metrics in the sidebar, use the drag handle to reorder metrics, click the x button to delete a metric, and use the search feature to locate and switch out any currently selected metric. Once you have selected the metrics you wish to include, click the Apply button, or click Cancel to exit the configuration dialog without saving any changes you have made.
Metrics Preset:
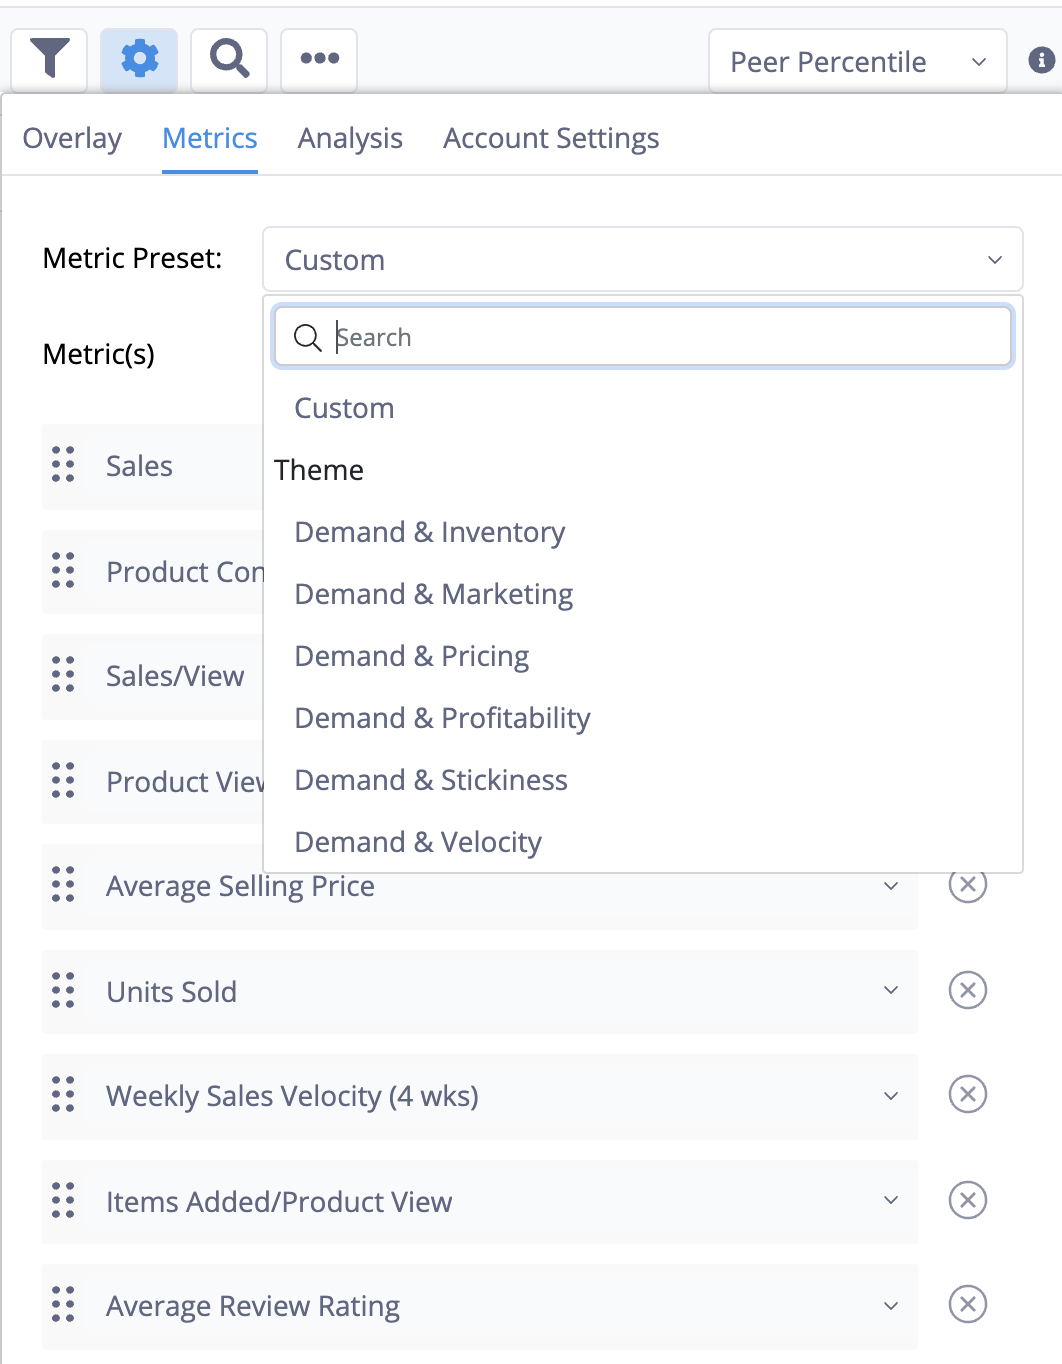
Preconfigured metric groups are also included in the Metrics section of the DynamicView configuration tab. If you wish to modify a Metric Preset, simply edit the individual metric selections a usual. However, please note that the Metric Presets themselves cannot be modified. If you manually edit the selections after loading a preset configuration in the Metrics dialog, the preset option will update and display ‘Custom’. The most recent custom preset configuration is cached while you are working in the Metrics tab. If you load a preset and want to revert back to your most recent custom configuration, you can select the ‘Custom’ option from the menu.

Six theme-based metric configurations have been curated. Each preset contains the same first four metrics and are focused on product demand. The last six metrics relate to secondary topics like Inventory, Velocity, Pricing, etc. Just like the Overlay Metrics presets, Product Metric presets can be quickly changed and still support the ‘Custom’ option articulated previously.
All Product Metric preset configurations are provided in the table below:
|
METRIC OVERLAY PRESET NAME |
||||||
|
|
Demand & Inventory |
Demand & Marketing |
Demand & Pricing |
Demand & Profitability |
Demand & Stickiness |
Demand & Velocity |
|
Metric 1 |
Placed Order Value |
Placed Order Value |
Placed Order Value |
Placed Order Value |
Placed Order Value |
Placed Order Value |
|
Metric 2 |
Product Conversion |
Product Conversion |
Product Conversion |
Product Conversion |
Product Conversion |
Product Conversion |
|
Metric 3 |
Placed Order Value/View |
Placed Order Value/View |
Placed Order Value/View |
Placed Order Value/View |
Placed Order Value/View |
Placed Order Value/View |
|
Metric 4 |
Product Views |
Product Views |
Product Views |
Product Views |
Product Views |
Product Views |
|
Metric 5 |
Units Sold |
PPC Product Views |
Average Margin % |
Product Profit/View |
Units Sold |
Average Selling Price |
|
Metric 6 |
Inventory Value |
Email Product Views |
Average Selling Price |
Product Views |
Bounce Rate |
Units Sold |
|
Metric 7 |
Stock Units |
Affiliate Product Views |
Price Markdown % |
Product Profit % |
Exit Rate |
Weekly Sales Velocity (4wks) |
|
Metric 8 |
Stock Cover (4 wks) |
Display Product Views |
Promo Cost % |
SKU Availability |
Items Added/Product View |
Items Added to Cart |
|
Metric 9 |
SKU Availability |
CSE Product Views |
Stock Units |
Stock Cover (4 wks) |
Abandonment Rate |
Items Added/Product View |
|
Metric 10 |
Return Rate (4 wks) |
Social Product Views |
Stock Cover (4 wks) |
Return Rate (4 wks) |
Review Rating |
Abandonment Rate |
-2.png?height=120&name=EDITED%20Logo%20Dark%20-%20Color%20(1)-2.png)