-2.png?height=120&name=EDITED%20Logo%20Dark%20-%20Color%20(1)-2.png)
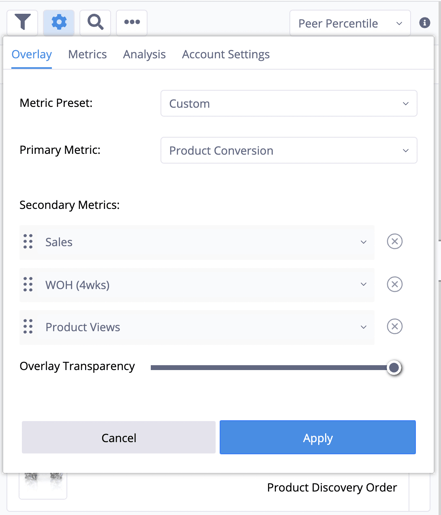
DynamicView loads a selection of primary, secondary, and preset metrics by default, but they can be quickly tailored to each individual user’s preference, job role, or analytic objective by clicking the cog icon and selecting the Overlay tab.
Primary Metric
Drop-down boxes allow you to search and select from over 200 KPIs. You can configure one primary and up to 3 secondary metrics to display in the page overlay.
Secondary Metrics
Secondary metrics can be reordered by dragging and dropping the metric tiles into desired positions. To remove a metric, click the delete (‘x’) button.
After making any metric changes, click the Apply button to save and update the Page Overlay configuration or Cancel to exit the configuration dialog without saving any changes.
Metric Presets
DynamicView allows users quickly switch between curated metric configurations that target various roles and areas of analytics focus.

The ‘Metric Preset:’ drop-down box presents 22 predefined metric selection configurations organized by job role and analytics theme. Metric Presets can be quickly applied to your DynamicView page overlay by selecting one of the options (which automatically loads the associated metric selections) and clicking the Apply button.
If you wish to modify a Metric Preset, simply edit the individual metric selections a usual. However, please note that the Metric Presets themselves cannot be modified. If you manually edit the selections after loading a preset configuration in the Overlay Metrics dialog, the preset option will update and display ‘Custom’. The most recent custom preset configuration is cached while you are working in the Overlay Metrics tab. If you load a preset and want to revert back to your most recent custom configuration, you can select the ‘Custom’ option from the menu.
Five role-based and 14 theme-based overlay metric presets have been configured for use. All presets include the Product Views metric as it is a key for evaluating the relative exposure a product receives and how it correlates to other key performance indicators. For example, the ‘Content Mgr’ role-based preset focuses on overlaying customer experience KPIs (Bounce Rate & Abandonment Rate) and compares them to topline Placed Order Value and Product Views generated by the product for the selected time period.
All Overlay Metric preset configurations are provided in the table below:
|
Preset Name |
Primary Metric |
Secondary Metric 1 |
Secondary Metric 2 |
Secondary Metric 3 |
|
ROLE PRESETS |
||||
|
Content Mgr |
Placed Order Value |
Bounce Rate |
Abandonment Rate |
Product Views |
|
Executive |
Placed Order Value |
Product Profit |
Inventory Value |
Product Views |
|
Financier |
Product Profit |
Product Profit % |
Inventory Value |
Product Views |
|
Marketer |
Placed Order Value |
PPC Product Views |
Email Product Views |
Product Views |
|
Merchant |
Product Conversion |
Placed Order Value |
Stock Cover (4 wks) |
Product Views |
|
THEME PRESETS |
||||
|
Acquisition |
New Customer Placed Order Value % |
New Customer Placed Order Value |
Reactivated Customer Placed Order Value % |
Product Views |
|
Availability |
SKU Availability |
Views Availability |
Demand Availability (last 4 weeks) |
Product Views |
|
BOPIS |
BOPIS Placed Order Value |
BOPIS Placed Order Value % |
BOPIS Units Sold |
Product Views |
|
BORIS |
BORIS Returned Order Value |
BORIS Returned Order Value % |
BORIS Units Sold |
Product Views |
|
Carting |
Items Added/Product View |
Items Added to Cart |
Abandonment Rate |
Product Views |
|
Conversion |
Product Conversion |
Placed Order Value/View |
Product Profit/View |
Product Views |
|
Demand |
Placed Order Value |
Product Conversion |
Placed Order Value/View |
Product Views |
|
Newness |
Days On Site |
Product Profit % |
SKU Availability |
Product Views |
|
Operating Profit |
Customer Profit |
Customer Profit/View |
Customer Profit % |
Product Views |
|
Pricing |
Average Margin % |
Average Selling Price |
Price Markdown % |
Product Views |
|
Product Profit |
Product Profit |
Product Profit/View |
Product Profit % |
Product Views |
|
Promos |
Promo Cost % |
Promotion Cost |
Promotion Cost/Unit |
Product Views |
|
Returns |
Return Rate (last 4 weeks) |
Returned Order Value |
Returned Units |
Product Views |
|
Reviews |
Average Review Rating |
Review Count |
Product Conversion |
Product Views |
|
Stickiness |
Bounce Rate |
Exit Rate |
Exit Page Views |
Product Views |
|
Stock |
Inventory Value |
Stock Units |
Stock Cover (4 wks) |
Product Views |
|
Velocity |
Units Sold |
Weekly Sales Velocity (4wks) |
Speed % |
Product Views |