Please note: this article refers to dashboards within the classic EDITED Market platform. For myEDITED Dashboards, refer to the myEDITED Help Centre.
You can now summarize your data stories with customizable widgets and create narratives within your analysis using Market Intelligence Dashboards.
This feature can be found in your left hand navigation panel under the Dashboards icon.
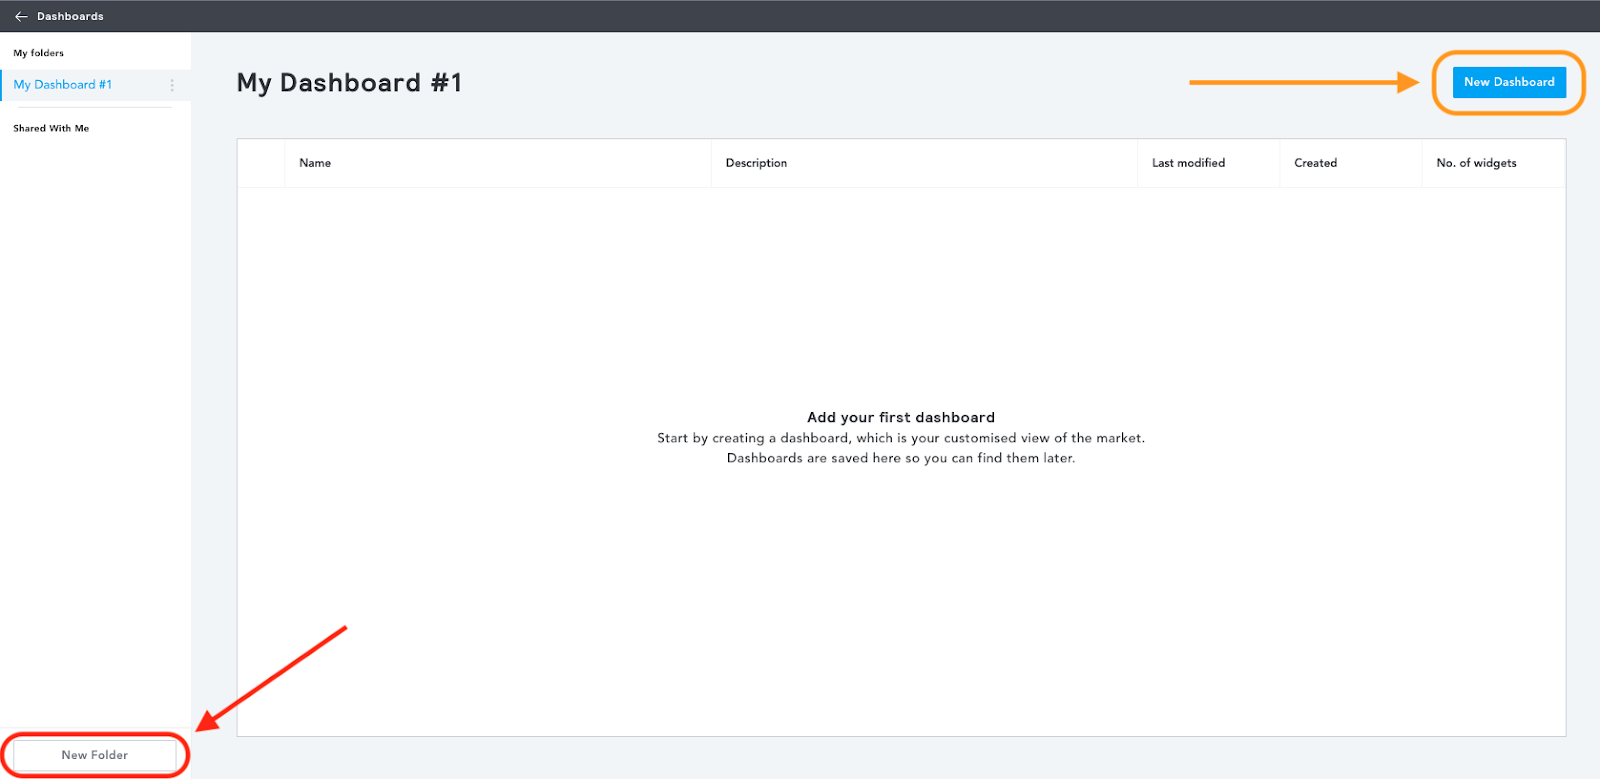
To get started, first select “New Folder” at the bottom left of your screen. Once you’ve created a folder, a button will appear in the upper right corner prompting you to begin a “New Dashboard.”
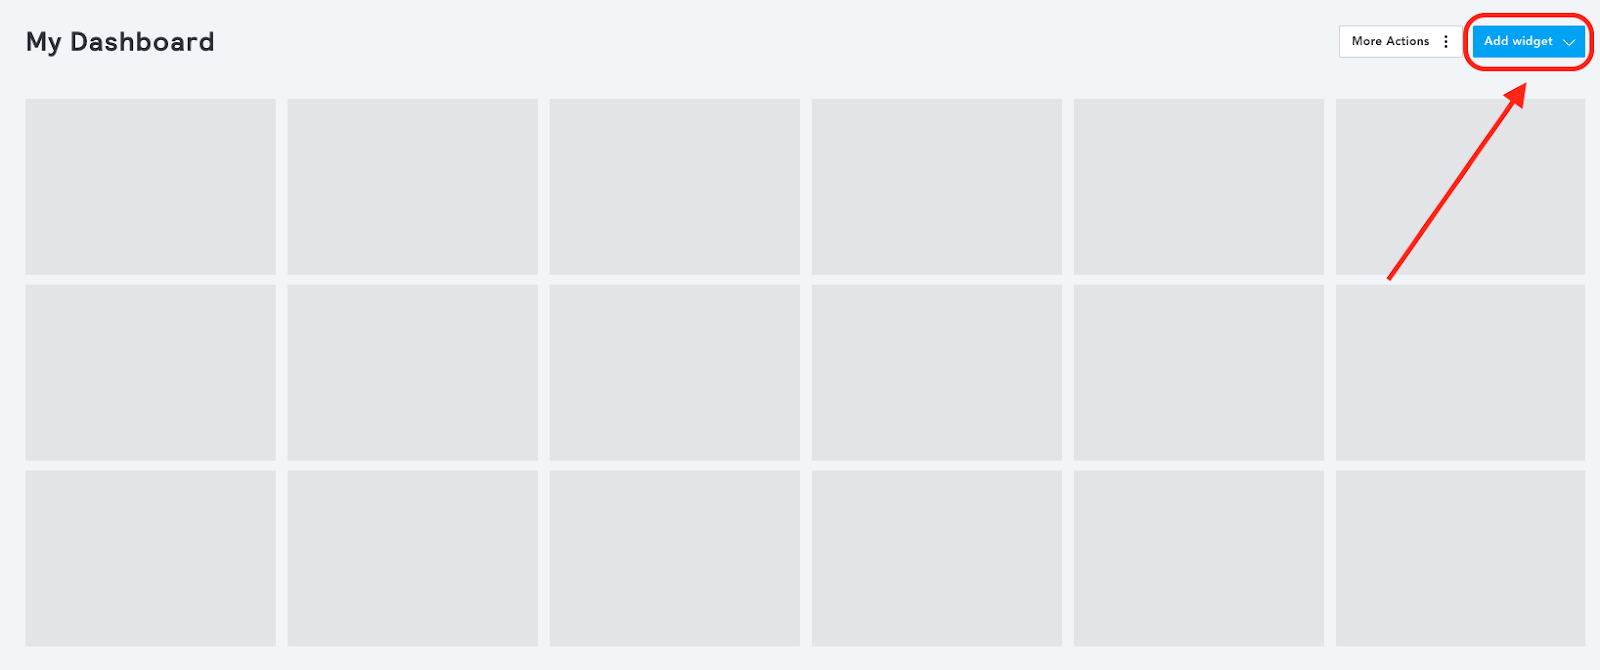
In your dashboard, create a new widget by clicking “Add Widget.”
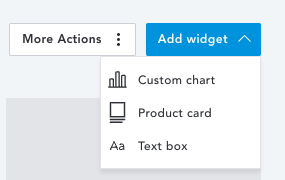
You will have a choice between 3 different Widget types: Custom Chart, Product Card, or Text Box.
Text Box
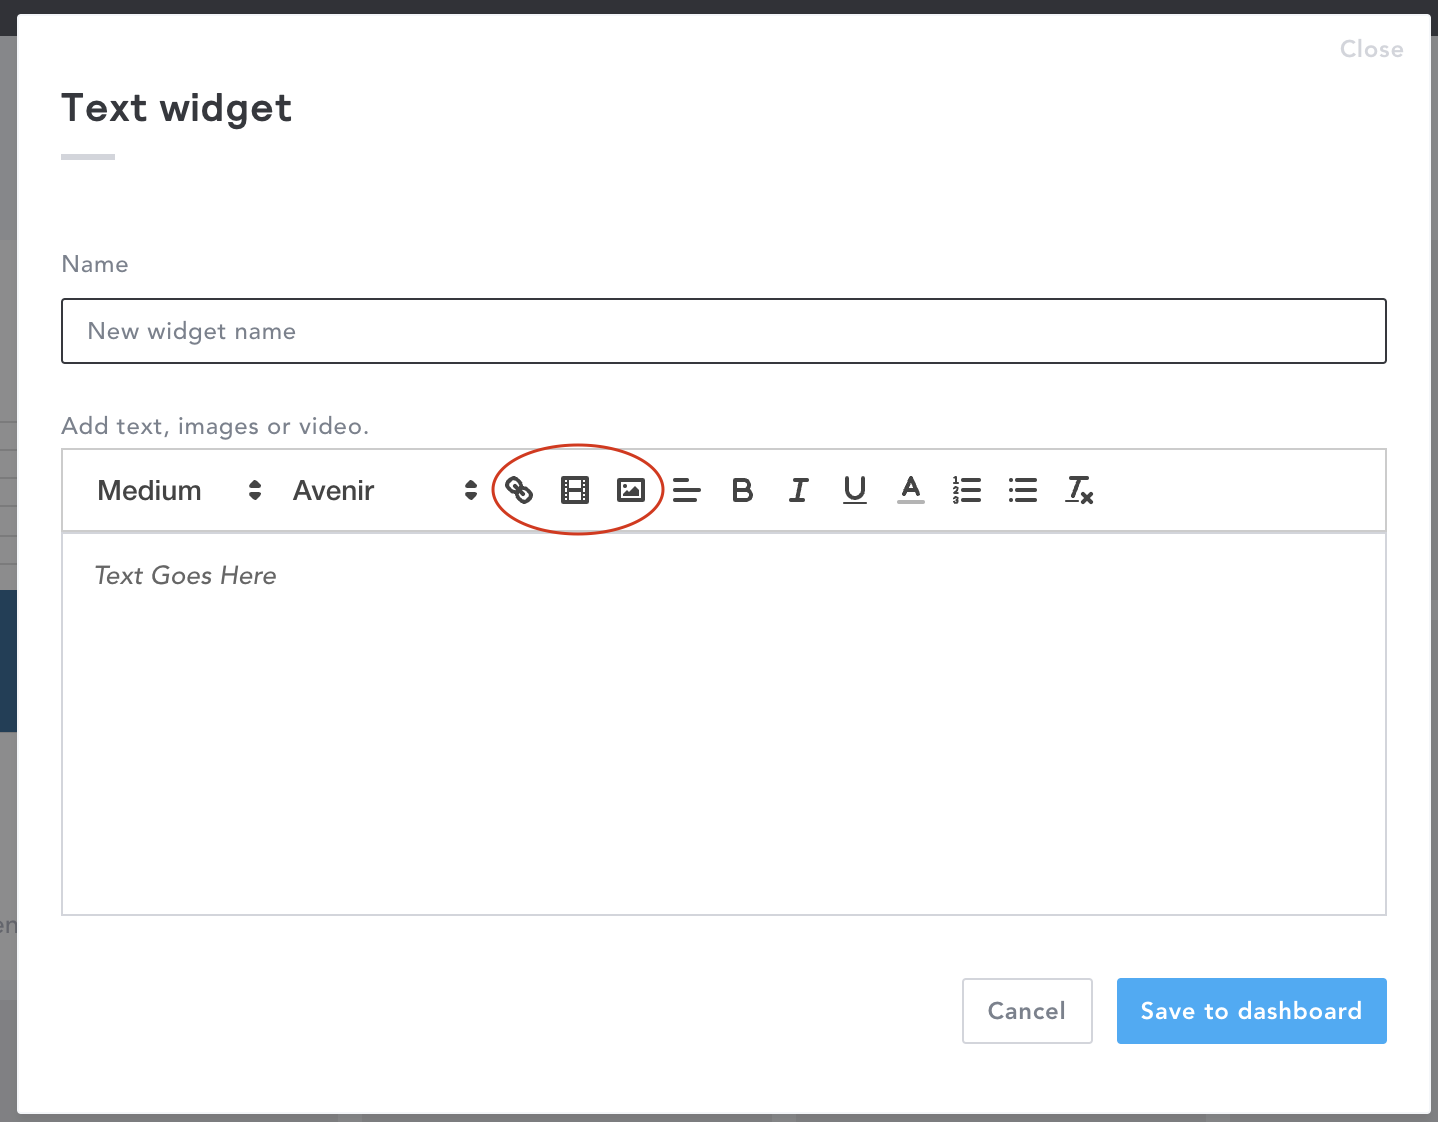
A Text Box widget can be used to add text, links, images or videos to your Dashboard. Type in your text and format using the toolbar at the top of the widget.
Use the link, video or image icon to imbed a link, video or image into your widget:
Product Card
Product Card widgets can display up to 10 product cards from Market Analytics at once. You can add filters to your filter panel from scratch as you would in a Market Analytics workbook.
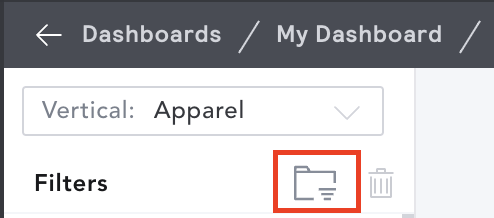
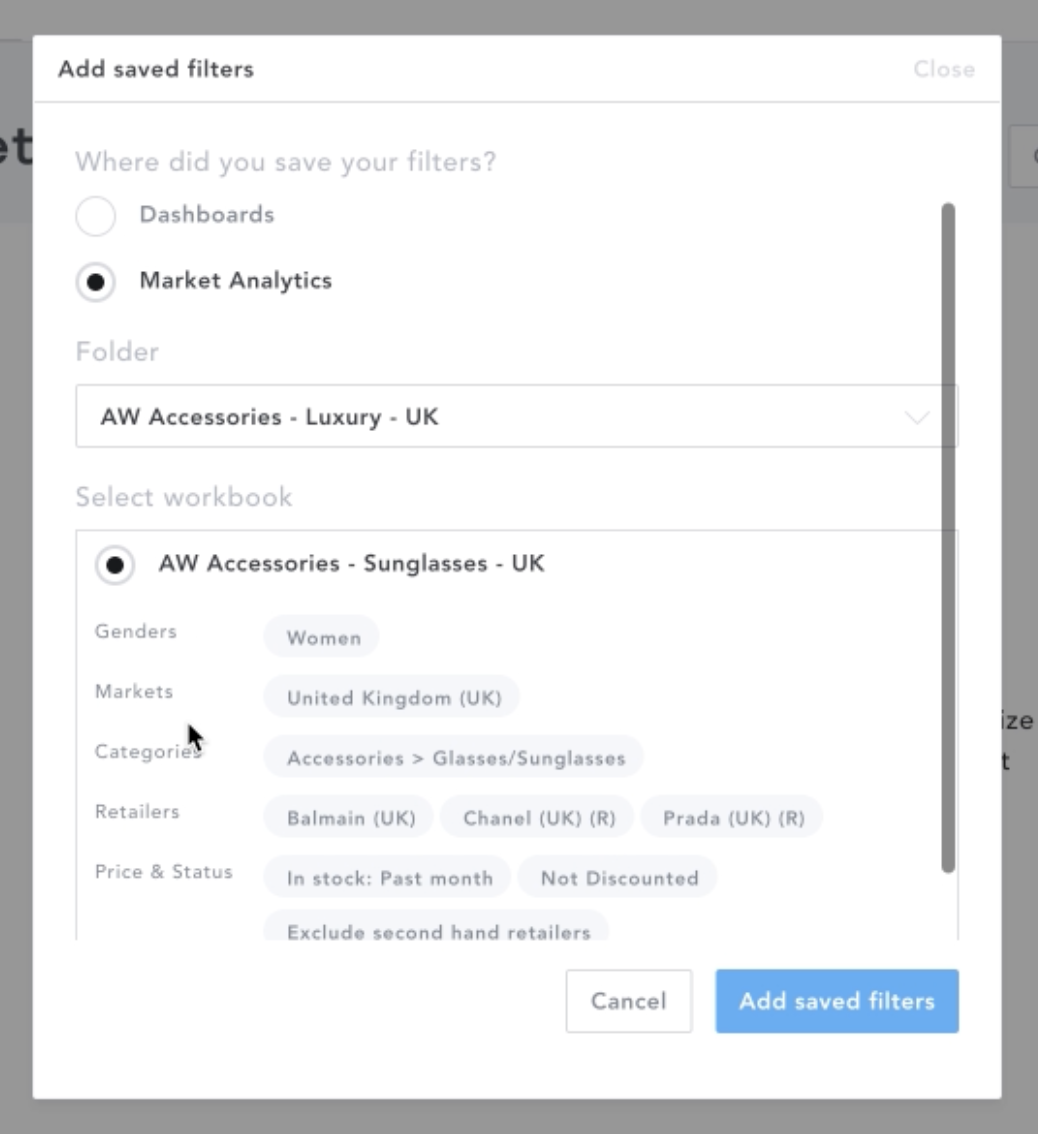
Alternatively, you can copy over a saved filter set from Market Analytics. Use the quick select button in the widget filter panel to easily pass your selected existing filter set into your dashboard.
Selecting a saved workbook from the drop-down will show you a preview of the chosen filters that will then be applied to your widget.
Once you have a filtered set of products, click “Add to Widget” below the image on the items you’d like to select. You can add up to 10 product cards to one widget.
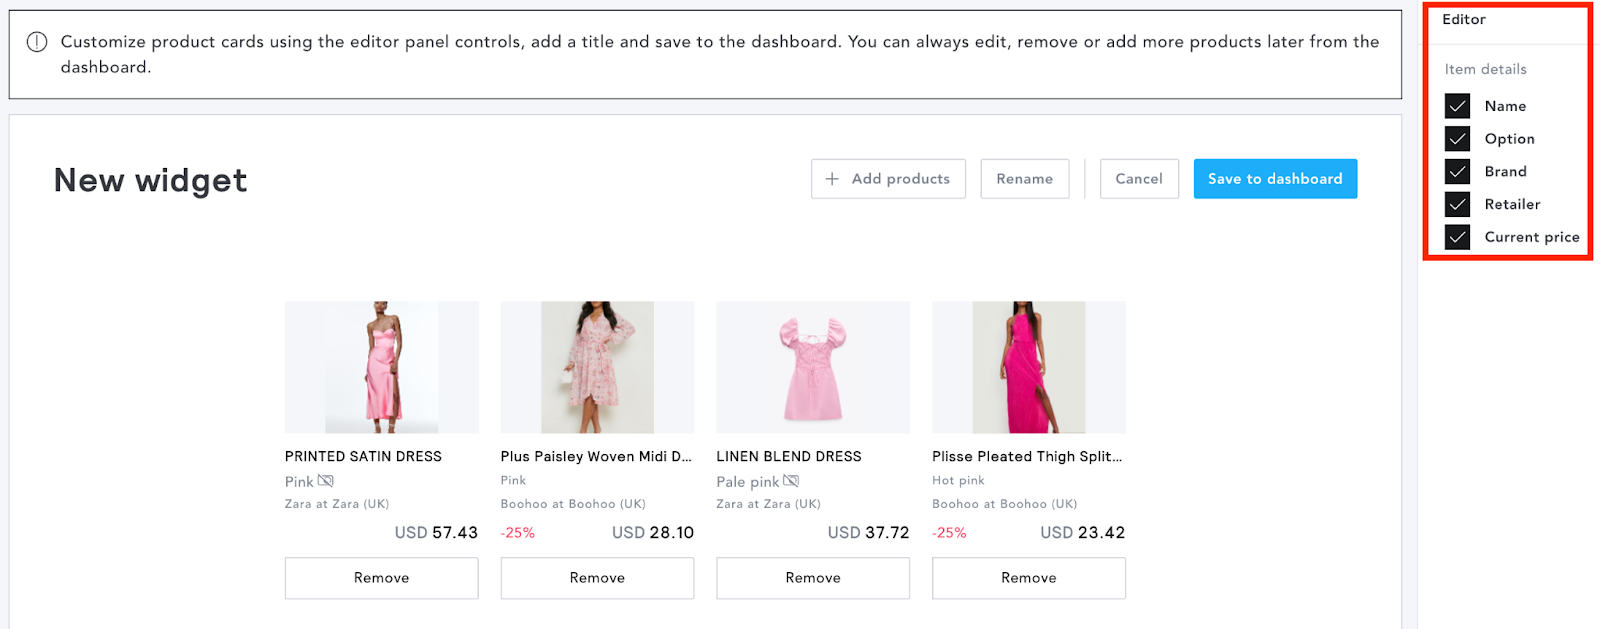
The “Edit Widget” button will take you to the widget itself, where you can customize how the products will be displayed and how much information you’d like to include on the thumbnails (name, option, brand, retailer, and current price).
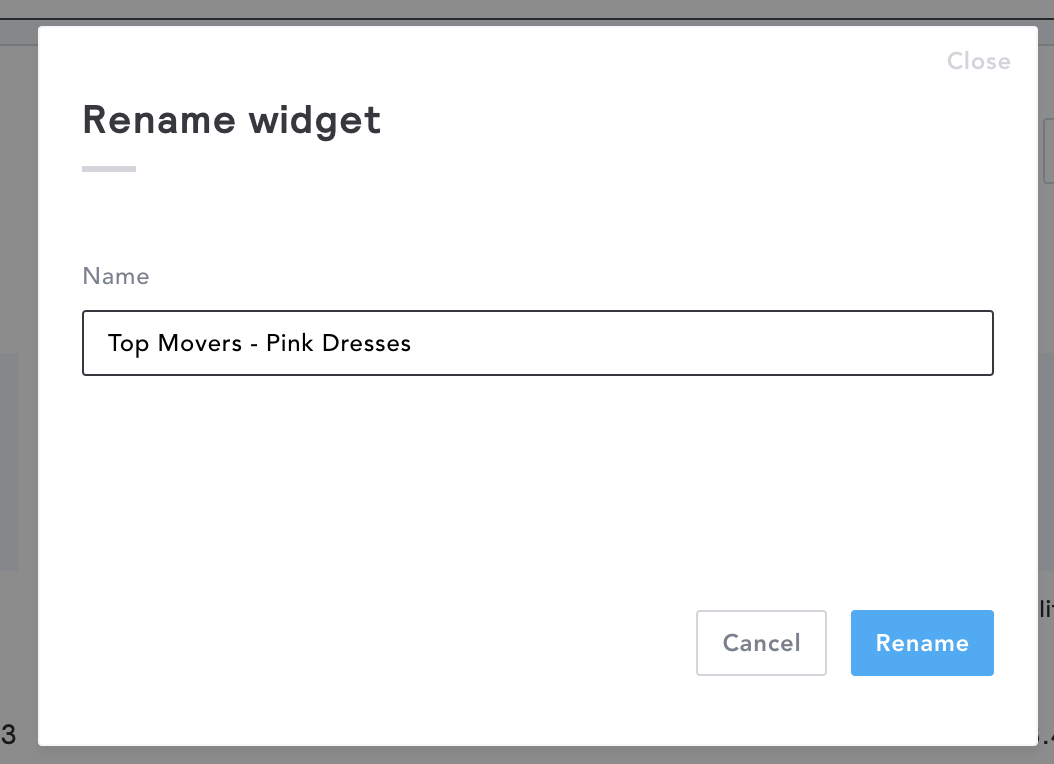
You can also choose to rename your widget.
Once you’ve created a widget, you can move or resize by dragging the widget around your dashboard or pulling on the triangle in the bottom right corner.
Custom Chart
The chart widget allows you to build your own custom charts and graphs to analyze pricing, discounting, and counts. Add filters to your filter panel as you would in a Market Analytics workbook, or copy over a saved filter set using the steps outlined above.
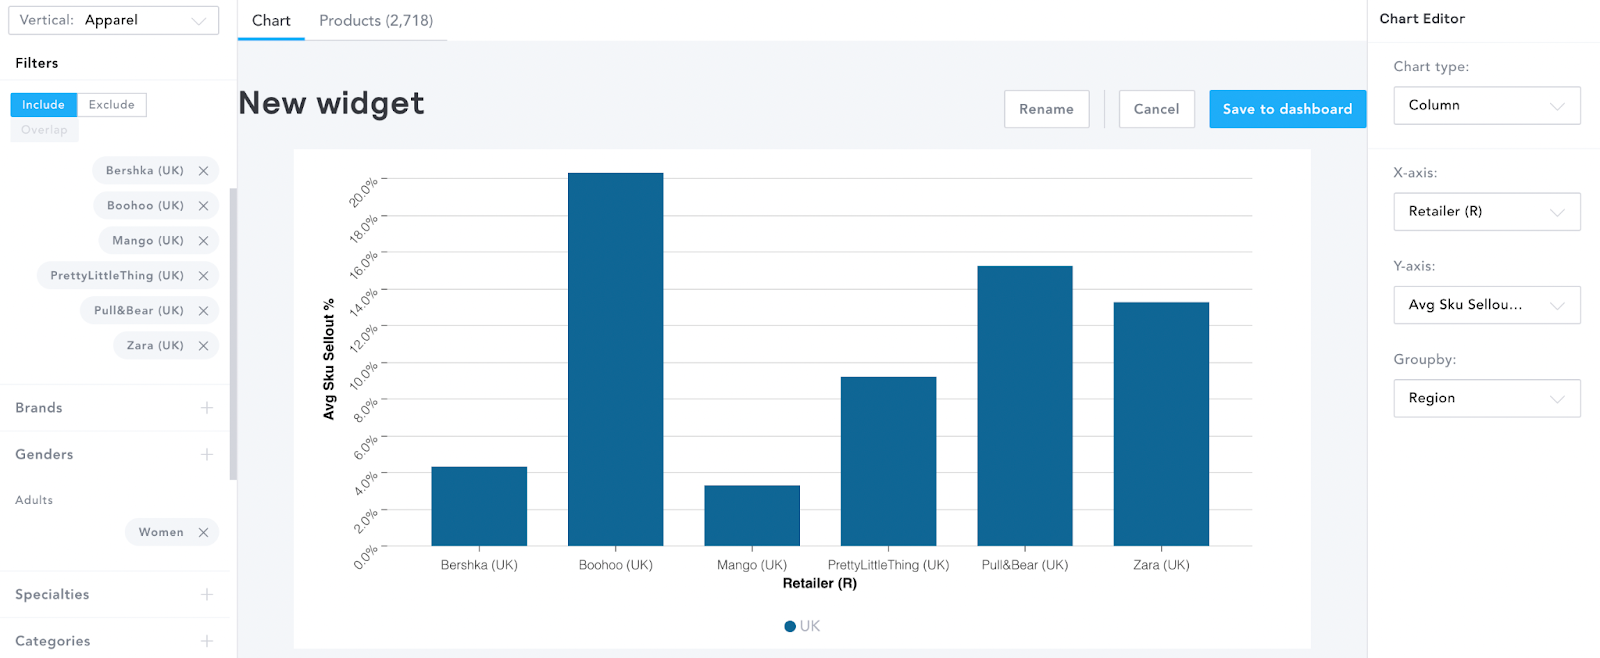
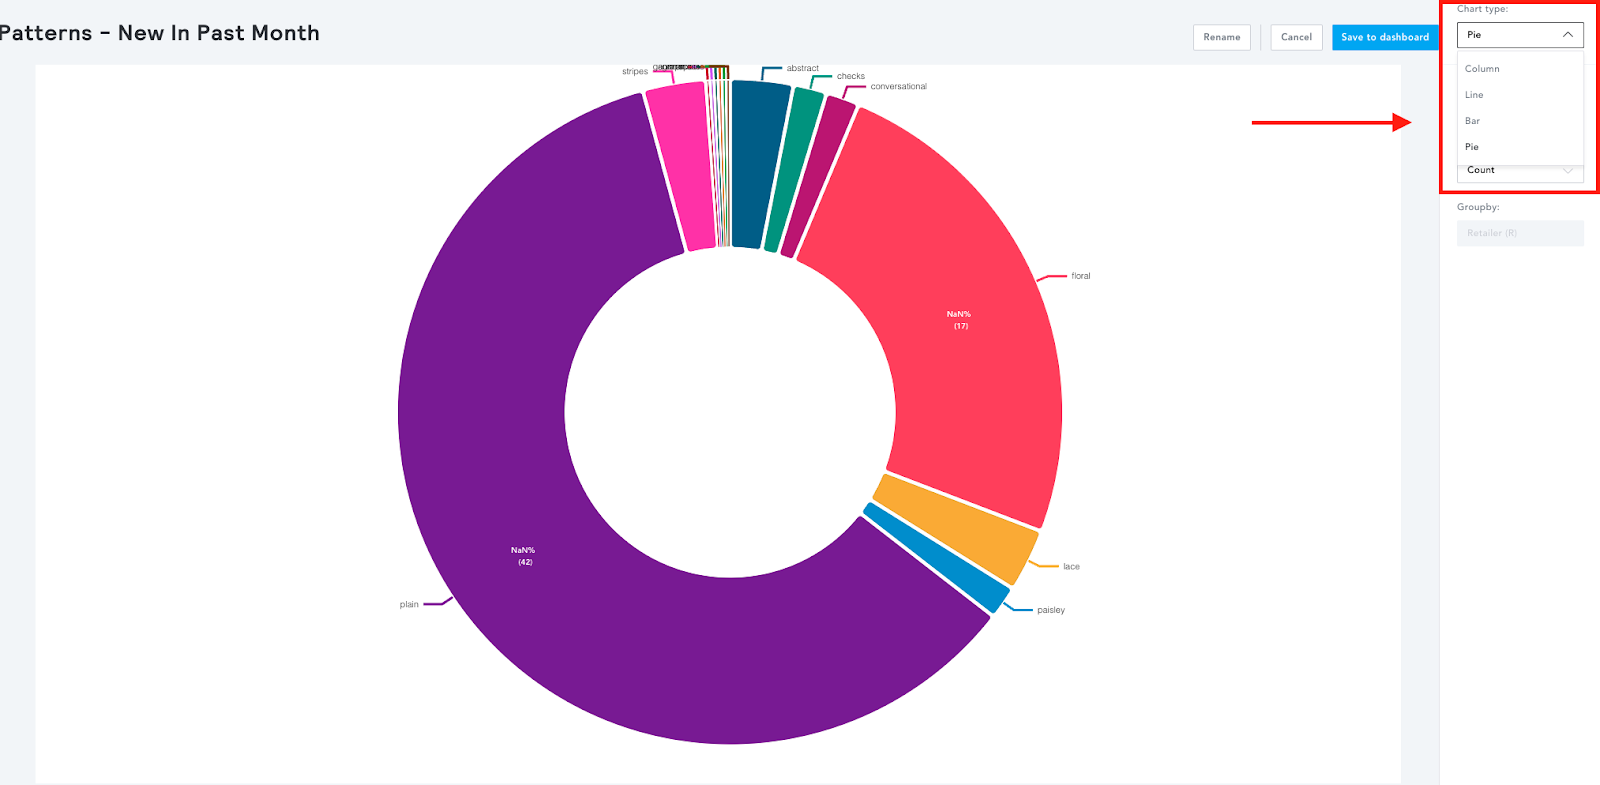
You have the ability to format your chart as a Column, Line, Bar, or Pie chart depending on how you’d like to visualize the data.
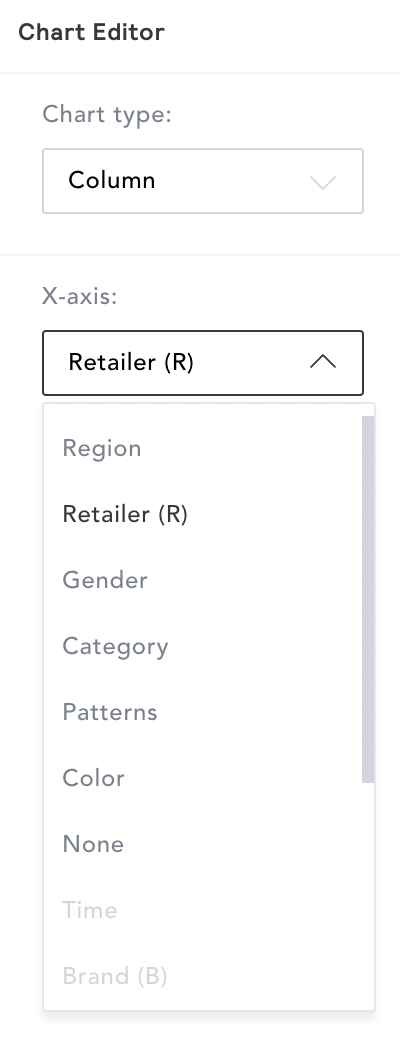
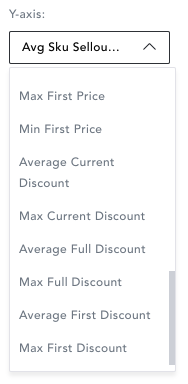
The X and Y axis can be manipulated via the dropdown menu on the right hand side of the page.
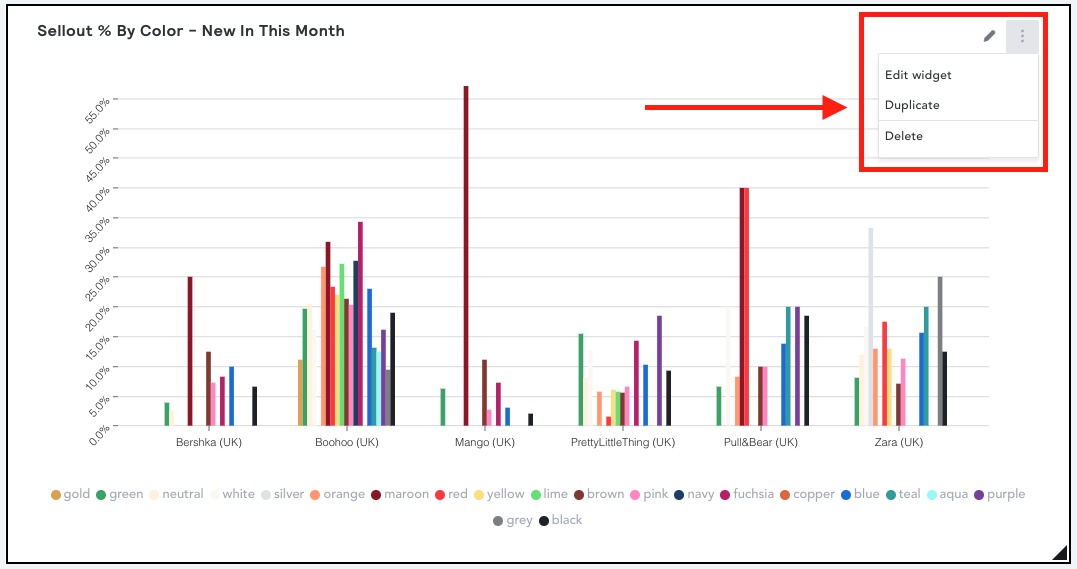
To create a new chart widget with the same filter set, click the 3 dots in the top right corner and select “Duplicate.” You can then use this copy as a base to start your next chart widget.
To share a Dashboard with your colleagues, you can save it down in your Team which will allow all members of that team to view your widgets. For more information on how to create a Team, click here.
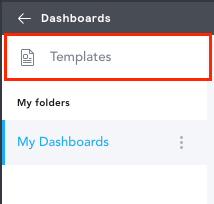
Your Retail Strategist can also create custom Dashboard Templates to share with your organization, tailored towards your specific analysis needs. Once a Template is shared with you, you will find this in the "Templates" folder at the top of your Dashboards navigation panel, and be able to use it as a base to create your own personal Dashboard. Please reach out directly to your Customer Success team representatives to learn more!