When analyzing competitors’ discounting strategies, EDITED has specialized analysis tools enabling you to analyze price changes and discounting cadences historically.
Analyzing Competitors First Discounts
Once you’ve created a workbook selecting the retailers and brands you would like to analyze, set a custom date range within the Date & Timeline filter under First Discounted to see all products that first experienced a price reduction during that time.
TIP: Remember to remove the In Stock filter in order to view all products available over the historical time period you are analyzing. If you do not remove this filter, you will only be looking at products that are still in stock to this day.
DISCOUNTS
Setting the discount level to First discount will display the level of discounting tracked by EDITED the first time the price of a product was reduced.
Analyzing First discount levels can give you an indication of what discount percentage intervals each retailer first intended to set within their discounting strategy.
Toggling to Deepest discount will change the chart view to indicate the deepest discount level these products ever reached. Noting the difference between the First and Deepest discount levels, you can analyze whether the intended discounting strategy was successful or if these retailers needed to make further price adjustments to improve sales. The Discounts tool can help you get your discounting strategy right first time, meaning time and financial resources can be budgeted correctly without last minute changes.
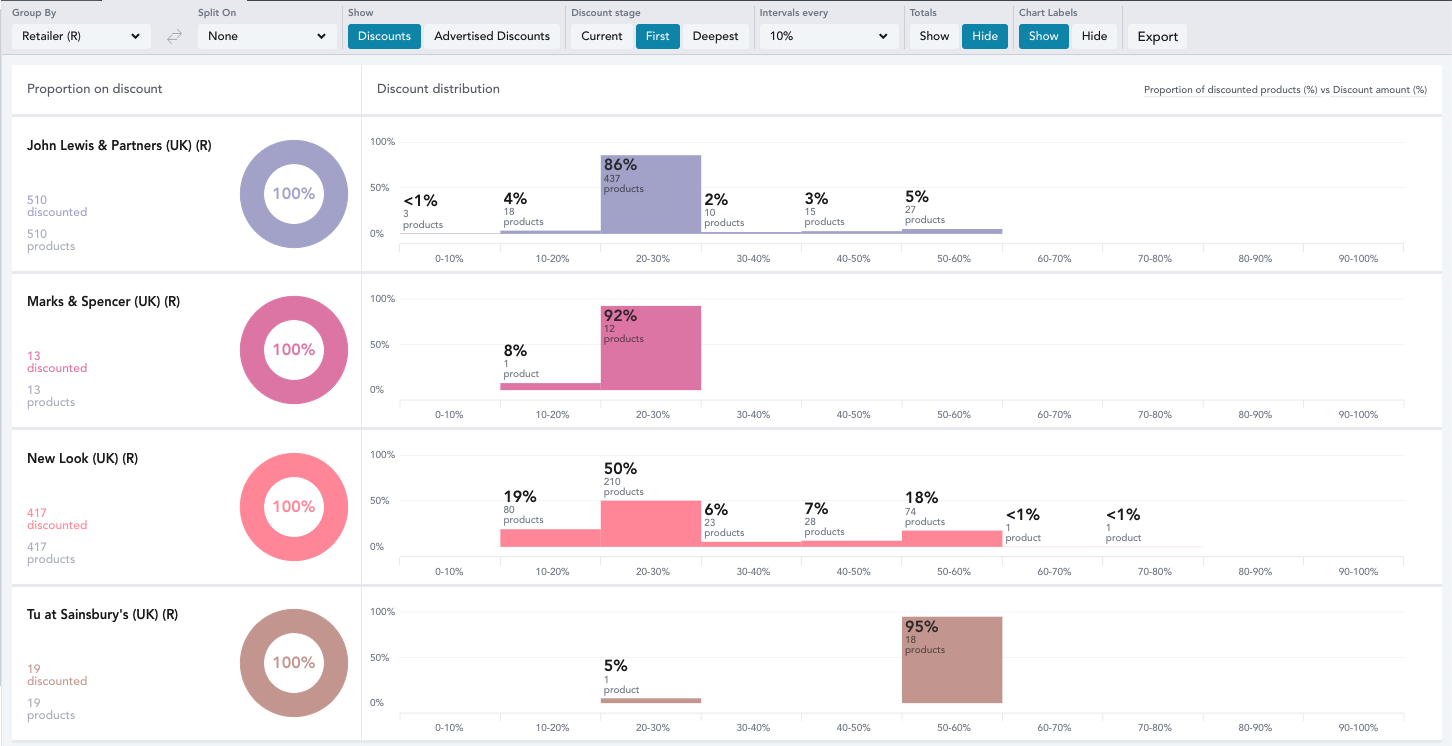
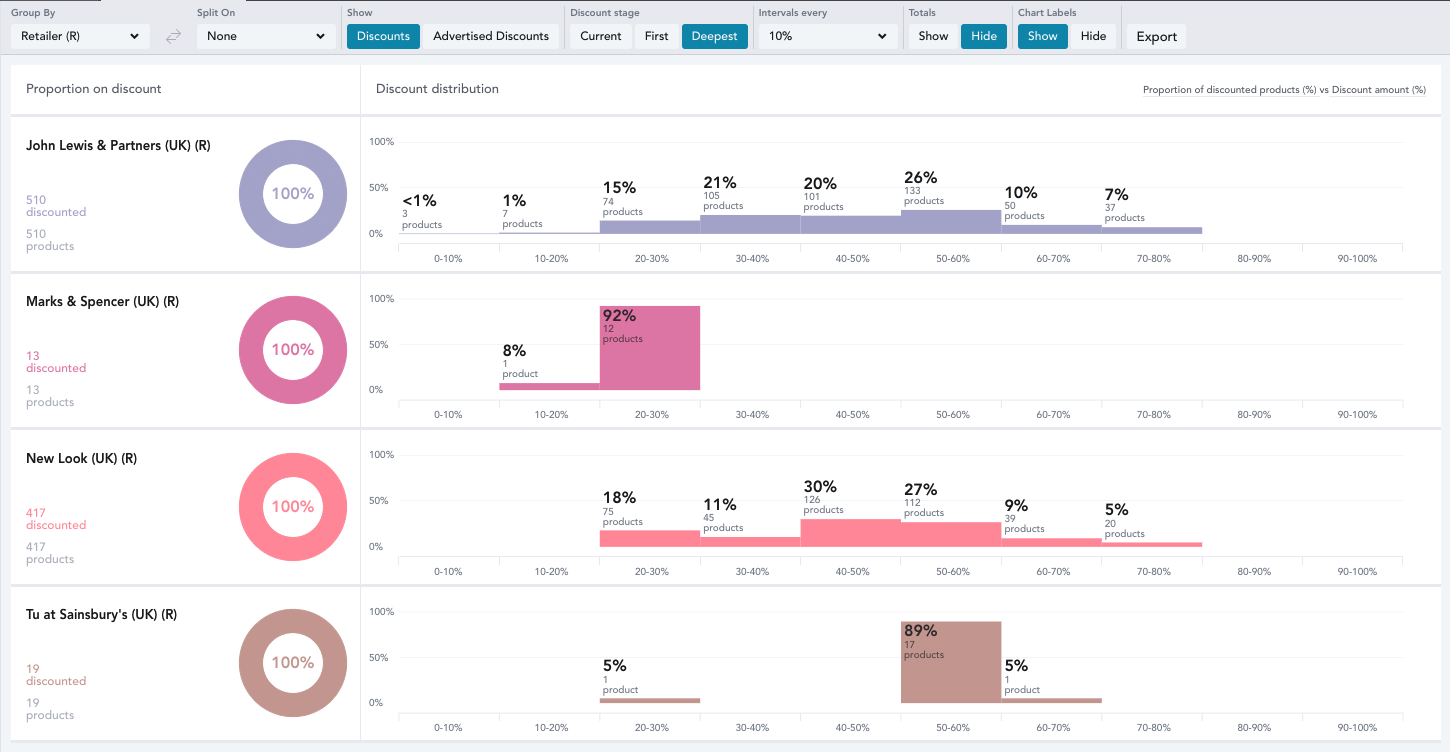
In the above example, John Lewis & Partners and New Look first discounted the majority of their sale products at the 20-30% off discount level. As you can see, their Deepest discount levels then spread out greatly, spanning more evenly across 20-60% and even as high as 80%.
Marks & Spencer and Tu at Sainsbury’s meanwhile, remained consistent with only a very slight variance from where their products were initially discounted. This could indicate that their discount strategy was successful the first time with no need to deepen discounts, whereas John Lewis & Partners and New Look might not have seen their discounted products move as quickly, and had to deepen their discounts as a result.
NOTE: Just as within all other Pricing analysis tools, the data reflected in this chart reflects the last time EDITED tracked these products. The “Current” discount level represents the price of each product’s cheapest SKU at the time it was last tracked.
Remember, you can also export this chart data into a spreadsheet to use in your reporting and analysis by clicking on the Export button within your chart controls.
DISCOUNT OVER TIME
Discount Over Time, provides a snapshot of the actual historical price and discount level during the time period being analyzed. Start by removing the selected time frame under the Date & Timeline filter and select the desired range in the chart controls at the top of the graph.
When analyzing discounts over a period of time, it is helpful to layer the charts for both Discount Amount and Discount Percentage within the Show Discount view in your chart controls.
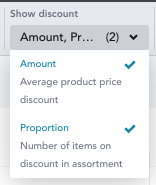
Oftentimes the Discount Percentage may appear particularly high with aggressive markdowns, but if you compare that to the Discount Proportion you may find for instance that the total number of items on discount is actually quite low, or vice versa.
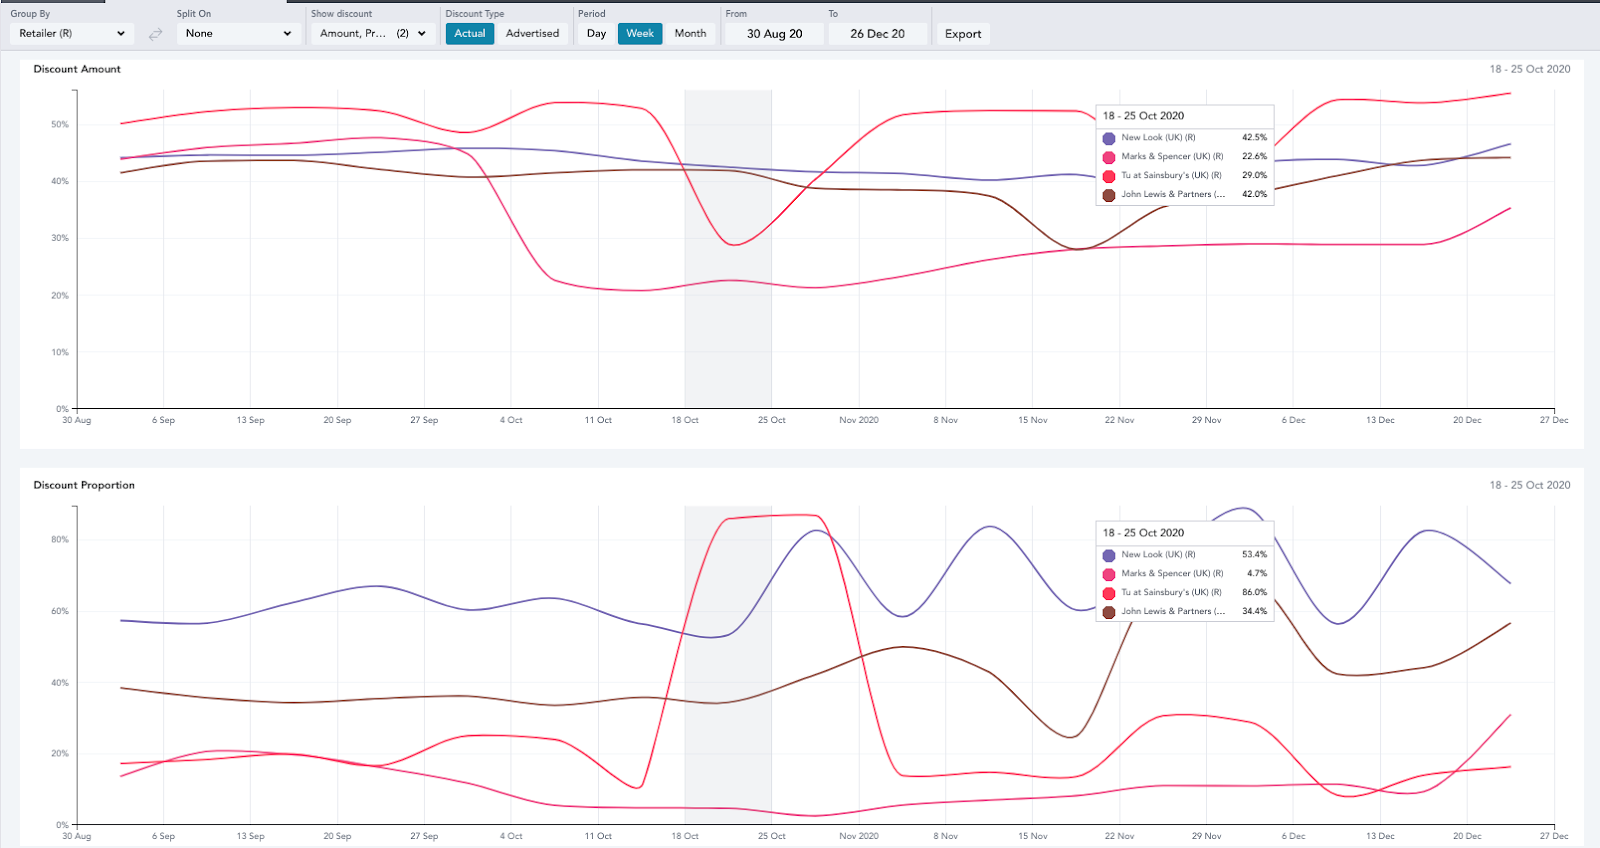
You can see an example of this in the screenshot above, observing Tu at Sainsbury’s during the week of October 18-25. The average actual discount percentage appears to be low, sitting at 29%, however the discount proportion is particularly high, tracking 86% of the total assortment with some level of true discounting.
Alternatively, in the week of December 6-13, the same retailer’s discount percentage was at a high average of 54%, but only 8.4% of the total product assortment actually saw these price decreases.
Toggling the Discount Type to Advertised will also provide insight into whether these retailers were communicating discount levels to consumers that were deeper than the actual tracked price changes - strategically letting the consumer think they are getting a bigger deal by purchasing at this sale level.