Who & Where visualizes the breakdown of retailers and brands within your workbook.
To view Who & Where, add a new tab to your workbook by selecting the + symbol:

Then select Who & Where:

Who & Where shows the distribution of products across retailers and brands.
Retailers and Brands are listed in descending order of number of products stocked. This is visually represented using the bars, which indicate the amount of difference between points.
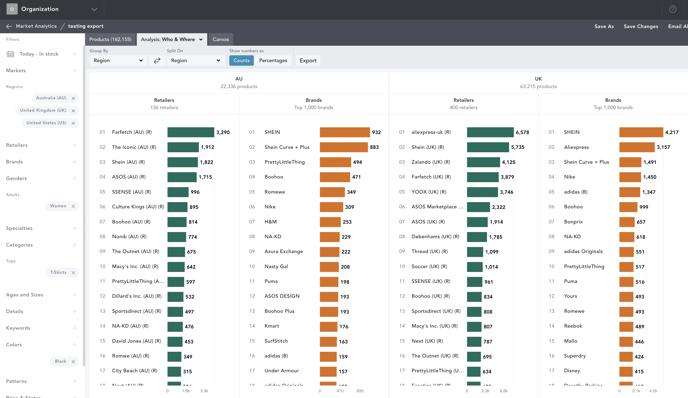
Retailers refer to where the product is stocked, and Brands refers to who the products are by.
Note: When analyzing Homeware, clicking into a specific product in the chart drilldown will take you to the base option page for this product (rather than the SKU specific one). Please keep this in mind when performing price analysis as the SKU split by size may show varying price levels.

- Use the Group By and Split On drop downs to see your data by-
- Aggregate: see all the products in your workbook represented
- Region: see the data by each region selected in your workbook
- Segment: see the data per market segment selected in your workbook
- Retailer (R): see the data per retailer selected in your workbook
- Brand (B): see the data grouped by the brands selected in your workbook
- Gender: see the data per gender selected in your workbook
- Category: see the data per category selected in your workbook
- Product Details: see the data per product detail selected in your workbook
- Keywords: see the data per keyword grouping in your workbook
- Patterns: see the data per pattern selected in your workbook
- Show numbers as allows you to see products by counts or by percentages, below we've selected to see Counts.

The Who & Where chart can be exported and emailed to you in Excel format. Ensure your workbook is saved and then click Export at the top of your chart controls.
