To view Top Words add a new tab to your workbook by selecting the + symbol:

Then select Top Words.
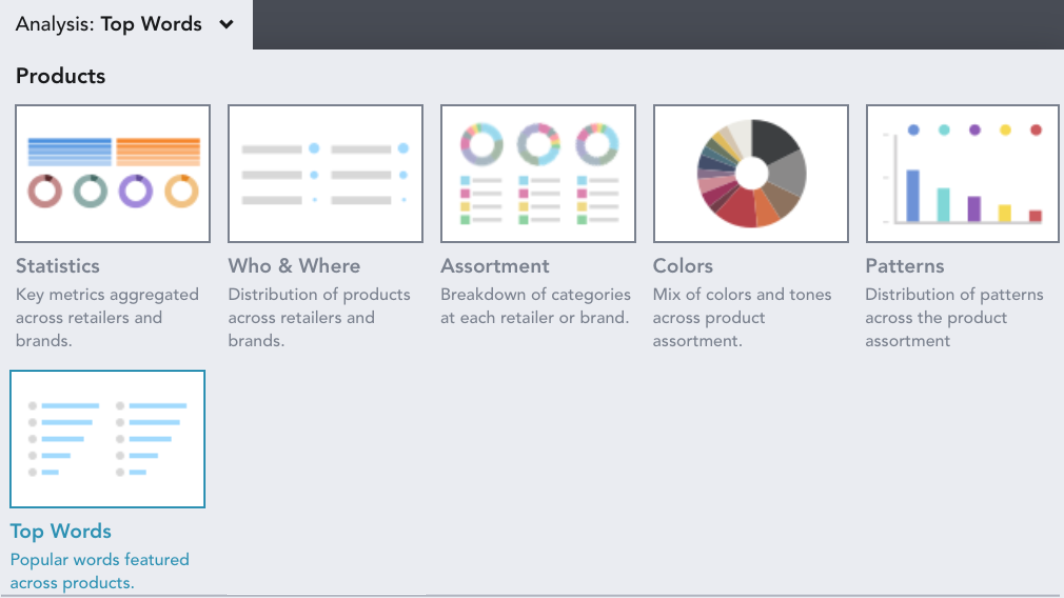
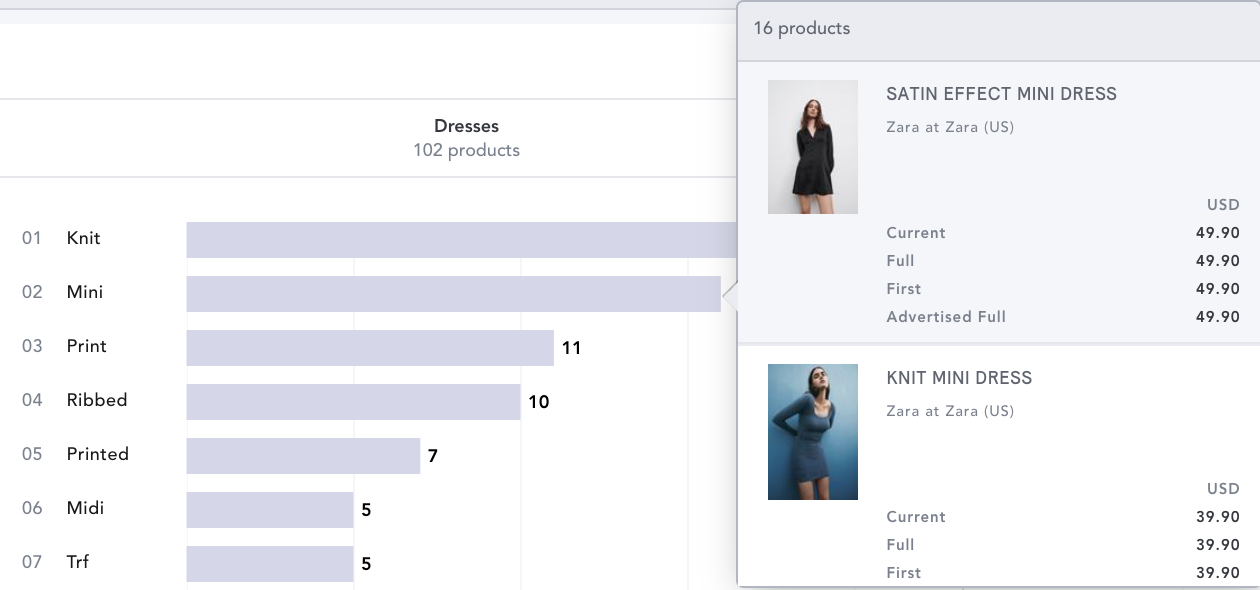
Top Words surfaces the most commonly used words within a selected assortment.
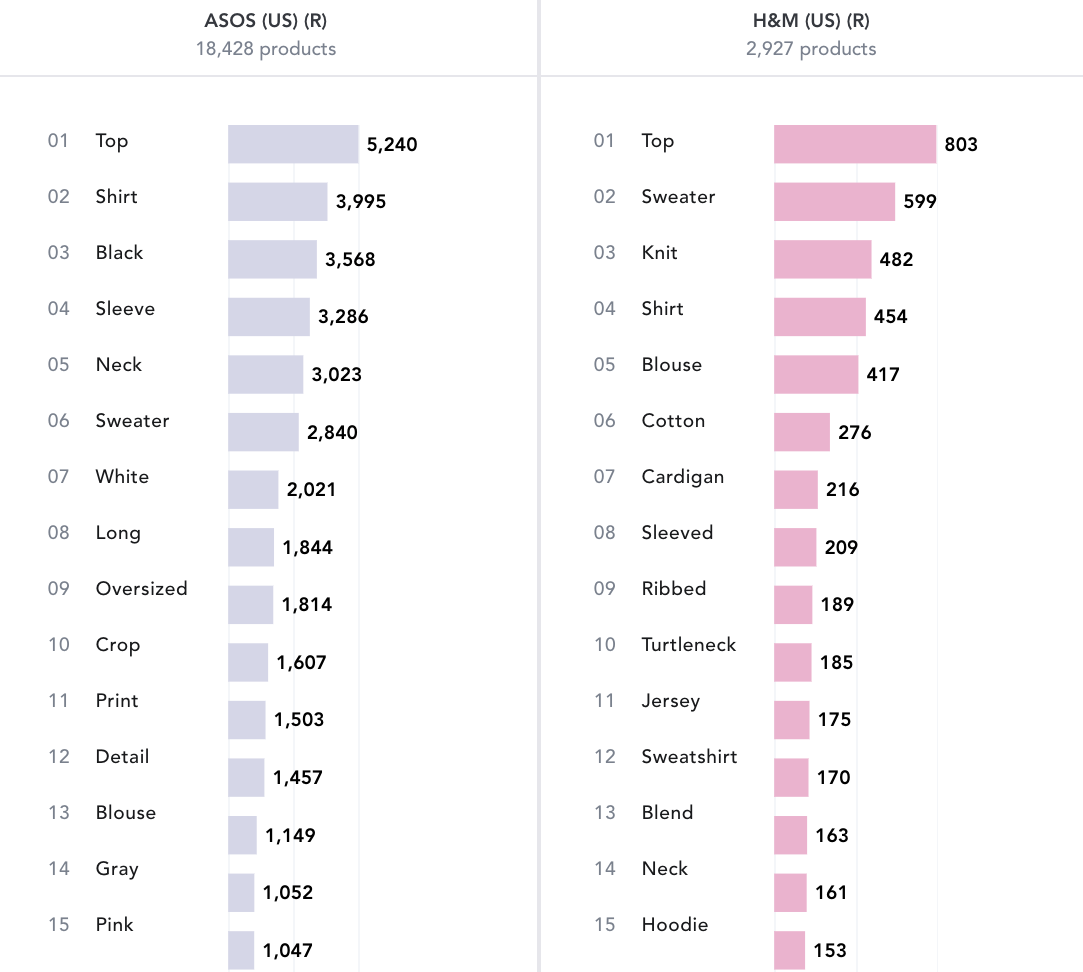
The bars indicate the number of products that mention that word, in the product field the search is targeting (name, care or description). You're able to see up to the 50 most common words within the analysis.
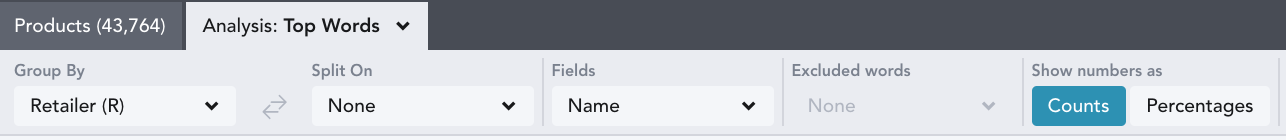
You can use EDITED's Chart Controls to alter the information presented using the buttons at the top of your workbook.
In the video below, products are being grouped by Retailer, and split on Category. You can also customize which field Top Words is pulling from; the name of the product, its description, or its care details.
To exclude certain words from appearing within the Top Words chart, hover over the word you want to exclude and click on the X icon.

These words are then added to the Excluded words drop down list at the top of your workbook. You can re-add these words by clicking the checkmark next to them.
Drill down on specific ranked words to see the products behind the data.
Use the Group By and Split On drop downs to see your data by:
- Aggregate: see all the products in your workbook represented
- Region: see the data by each region selected in your workbook
- Segment: see the data per market segment selected in your workbook
- Retailer (R): see the data per retailer selected in your workbook
- Brand (B): see the data grouped by the brands selected in your workbook
- Gender: see the data per gender selected in your workbook
- Category: see the data per category selected in your workbook
- Product Details: see the data per product detail selected in your workbook
- Keywords: see the data per keyword grouping in your workbook
- Patterns: see the data per pattern selected in your workbook
- New In: see the data on new in products in your workbook per time frame selected
- First Sell Out: see the data on first sell out of products in your workbook per time frame selected
- First Discounted: see the data on first discount of products in your workbook per time frame selected
- In Stock: see the data on in stock products in your workbook per time frame selected
The Top Words chart can be exported and emailed to you in Excel format. Ensure your workbook is saved and then click Export at the top of your chart controls.

Counts and percentages can be found on their own respective tabs in the exported document.