Market: How Do I Use Strategy?
To view Strategy add a new tab to your workbook by selecting the + symbol:
Then select Strategy:

Strategy shows how retailers and brands position their assortment across price points and how their products are performing.
EDITED's Chart Controls will let you select how you want to view this data. You can choose to group the data by and split on the following criteria:- Aggregate: see all the products in your workbook represented on the strategy table
- Region: see the strategy table per region selected in your workbook
- Segment: see the strategy table per market segment selected in your workbook
- Retailer (R): see a strategy table per retailer selected in your workbook
- Brand (B): see the strategy table grouped by the brands selected in your workbook
- Gender: see the strategy table per gender selected in your workbook
- Category: see the strategy table per category selected in your workbook
- Product Details: see the strategy table per product detail selected in your workbook
- Keywords: see the strategy table per keyword grouping in your workbook
- Patterns: see the strategy table per pattern selected in your workbook
- Flash Sales: see the strategy table per flash sale selected in your workbook
You can also select to view by Current, Full, Advertised Full or First price.
The video below shows grouping the data by region and splitting on the brands selected in the workbook based on their current price and then switching this information so that it is grouped by the brands and split on the region:

Positioning
Product count shows the total number of items of that type.
Price Points:
- Minimum: The lowest priced product within the product set
- Median: The middle price within the product set
- Maximum: The highest priced product within the product set
Performance
The Performance bars indicate the percentage of that brand/retailer’s assortment that:
- Is Sold Out
- Has been replenished
- Is currently discounted (and the average level these products are discounted by)
- Is currently advertised as discounted (and the average level of advertised discount)
- Is currently increased in price
- Belongs to Outlet
(Note: See below for further definitions of these terms)
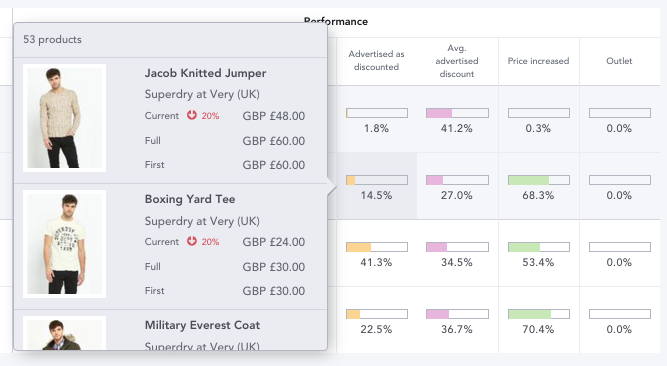
Click a bar to see a list of relevant products.

Performance Bar definitions:
Sell out: See the percentage of products that have sold out at least once at the retailer or brand (A product is sold out when 100% of SKUs have gone out of stock, having previously been in stock).
Replenished: See the percentage of products that have been replenished at least once at the retailer or brand (A product is replenished when at least 51% of SKUs have returned to stock at the same time, where two or more SKUs were originally present).
Currently discounted: See the percentage of products that are currently on discount at the retailer or brand (a product is shown as discounted when the current selling price of any SKU is lower than the full price of that SKU).
Avg. Discount: See the average percentage products are discounted by at the retailer or brand (average discount percentage is the mean percentage that products have been discounted by across a retailer, brand, product type or assortment, according to the products in your workbook).
Advertised as discounted: See the percentage of products in the workbook that have an advertised discount.
Avg. advertised discount: See the average percentage products are advertised as being discounted by.
Price Increased: See the percentage of products that have increased in price from the price they were previously seen at.
Outlet: See the percentage of products that have outlet status in your workbook.