To view Price Index add a new tab to your workbook by selecting the + symbol:

Then select Price Index:

Price Index shows average prices across individual product types and retailers/brands, compared to an index point.
The table allows you to compare price points against a normalized average (index) or actual average price, for each product type and retailer/brand in your workbook.
The shopping bag total price is the total of all the categories that you have applied and the average price a customer would pay if they were to buy a product from all categories. For example, based on the screenshot below, if you were to buy a dress, top and bottoms from ASOS you would be likely to pay £98.94 on average.
The shopping bag average price is the average price that a consumer would be likely to pay if they were to buy a product from any of the categories that have been selected. For example, based on the screenshot below, if you were to buy either a dress, top or bottoms from ASOS you would be likely to pay £32.98 on average.
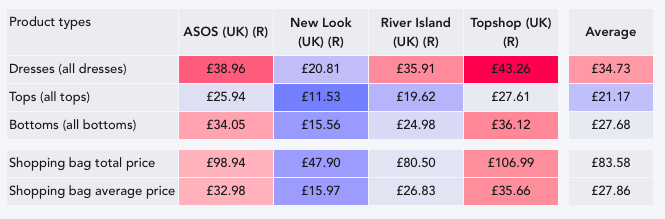
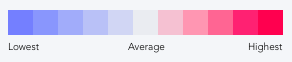
The colors of the heat map indicate the distance each price point sits compared to the average, where darker tones of blue indicates further distance below the average and darker tones of pink indicate further distance above average.
Use the Chart Controls at the top of your workbook to change states of the data in the table.

Use the Group By and Split On buttons to see your data by:
- Aggregate: see all the products in your workbook represented
- Region: see price index per region selected in your workbook
- Segment: see price index per market segment selected in your workbook
- Retailer (R): see price index per retailer selected in your workbook
- Brand (B): see price index grouped by the brands selected in your workbook
- Gender: see price index per gender selected in your workbook
- Category: see price index per category selected in your workbook
- Product Details: see price index per product detail selected in your workbook
- Keywords: see price index per keyword grouping in your workbook
- Patterns: see the data per pattern selected in your workbook
- Flash Sales: see price index per flash sale selected in your workbook
The video below shows price index being grouped by the selected brands and then split on the retailers that stock them. You can use the switch button to group the data by the selected retailers and split on the brands in your workbook:

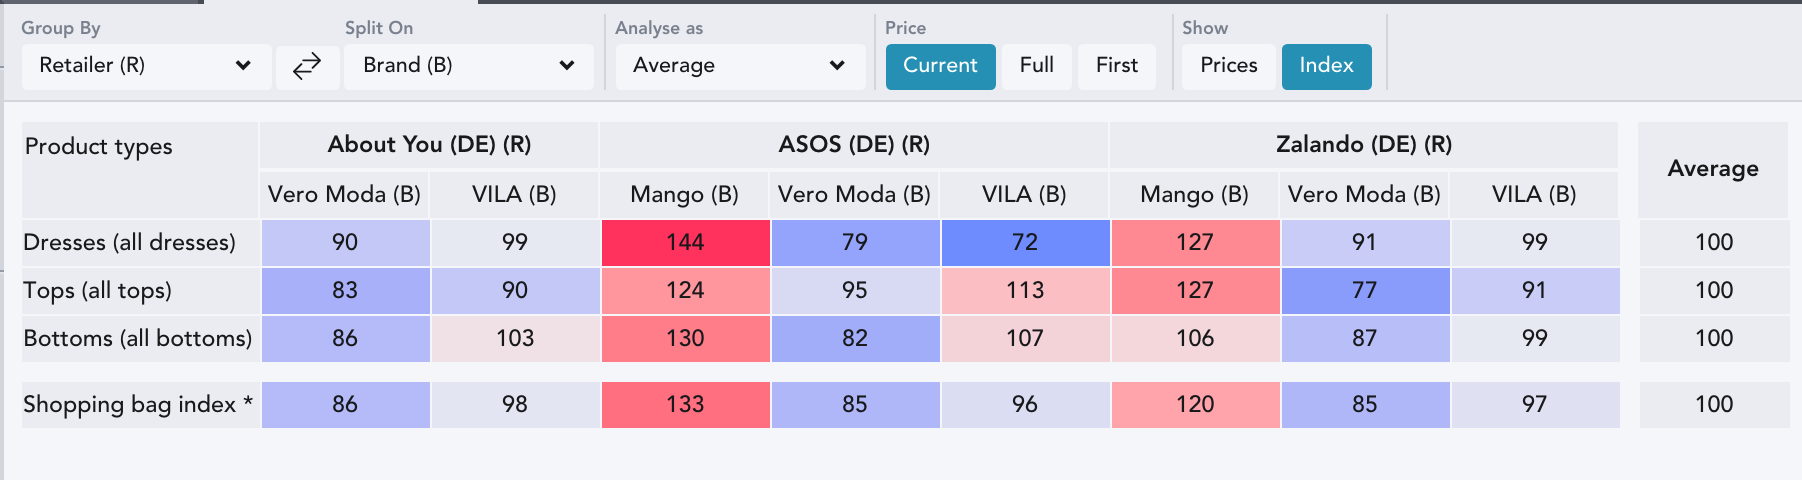
Selecting to Show: Index will give each price point with a value in relation to the index point of 100, where each row's average is set to 100 individually. The Shopping bag index is the indexed price across all product types selected. In this view, all the colors relate to the single index value, across all product types and retailers/brands. Here is a table where Index has been selected:
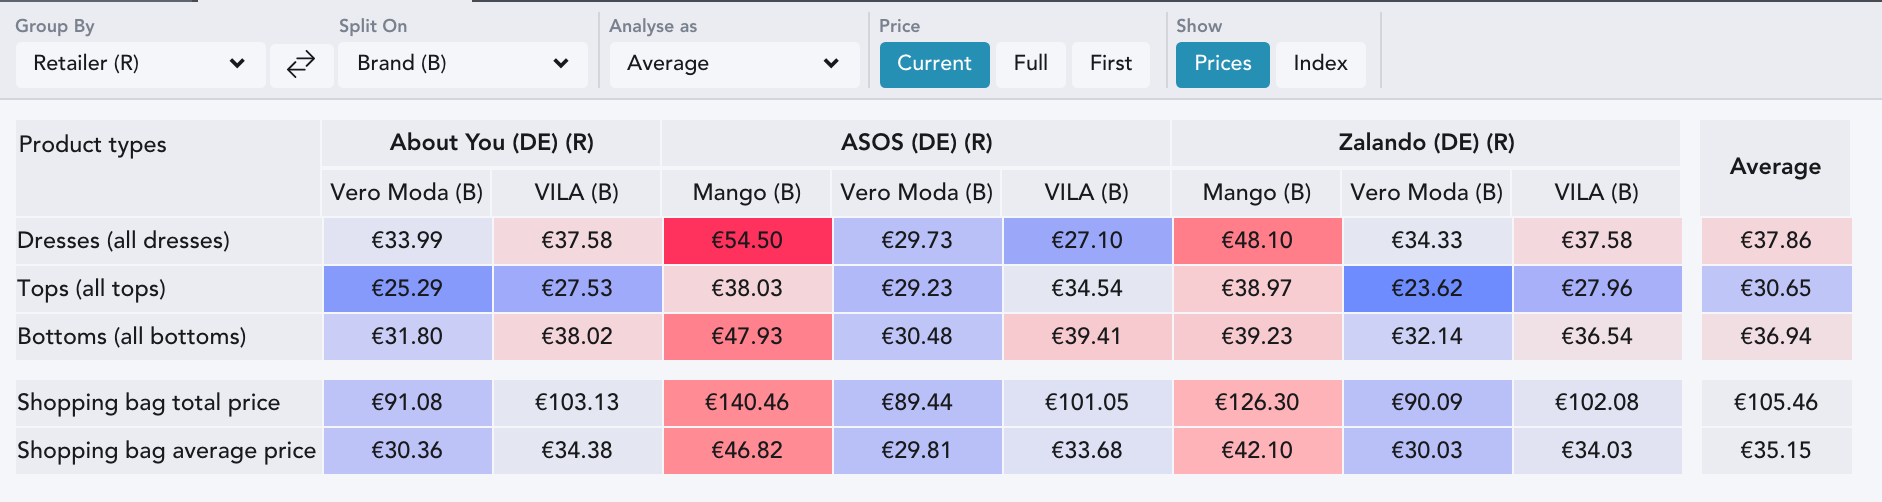
Selecting to Show: Prices lets you view the actual average price of each product type at each retailer/brand. The mean price of each product type across retailers/brands is displayed in the column on the far right, and the average for each retailer/brand across product types, is shown in the bottom row, called Shopping bag price. Below the total is the Shopping bag average price which shows you the mean price of each retailer. At the far right of the shopping bag price row, is the average of all shopping bag prices, which represents the mid-point of the color gradient, and all other cell colors are shown in relation to this. Here is a table where Prices has been selected:
You can choose which price point to view by selecting from the Analyze as buttons.
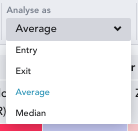
- Entry prices will show you the lowest price of a product of each type at each retailer.
- Exit prices are the highest price of a product of each type at each retailer.
- Selecting Average will show you the mean price of each product type per retailer/brand.
- Median will show the middle price of each product type per retailer/brand.
You can alter the state of the prices by selecting the different Price buttons.
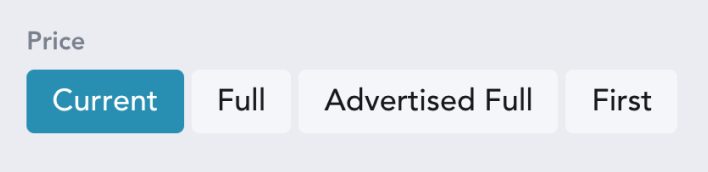
- Current will show values at the price the products are listed at now.
- Full will show values at the highest price the products have been seen at.
- Advertised Full Price will show values at the highest advertised price the products have been seen at.
- First will show values at the price the product first arrived on the market as.