Watch the video below to learn how to use EDITED's Options feature.
To view Options add a new tab to your workbook by selecting the + symbol:

Then select Options:

Options shows the breakdown of products by price point intervals. The bubbles indicate the number of products available at each price point.
You can use EDITED's Chart Controls to alter how the information is presented using the buttons at the top of your workbook.

Use the Group By and Split On dropdowns to see your data by:
- Aggregate: see all the products in your workbook represented
- Region: see the data by each region selected in your workbook
- Segment: see the data per market segment selected in your workbook
- Retailer (R): see the data per retailer selected in your workbook
- Brand (B): see the data grouped by the brands selected in your workbook
- Gender: see the data per gender selected in your workbook
- Category: see the data per category selected in your workbook
- Product Details: see the data per product detail selected in your workbook
- Keywords: see the data per keyword grouping in your workbook
- Patterns: see the data per pattern selected in your workbook
- New In: see the data on new in products in your workbook per time frame selected
- First Sell Out: see the data on first sell out of products in your workbook per time frame selected
- First Discounted: see the data on first discount of products in your workbook per time frame selected
- In Stock: see the data on in stock products in your workbook per time frame selected
In the video below, the data is grouped by retailer and split on the categories selected:
Use the Price point interval every dropdown to select the interval you want to view your products by. Select Custom to create your own.
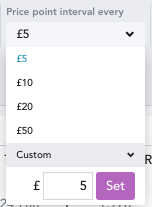
Each interval will include products from the lowest price in that bracket, up to .99 of the price before the highest value of that bracket. For example, if your intervals are set to £20, then all products with prices between £0 and £19.99 will fall within this bracket. Products that are £20 will fall in the price point above, £20-£40.

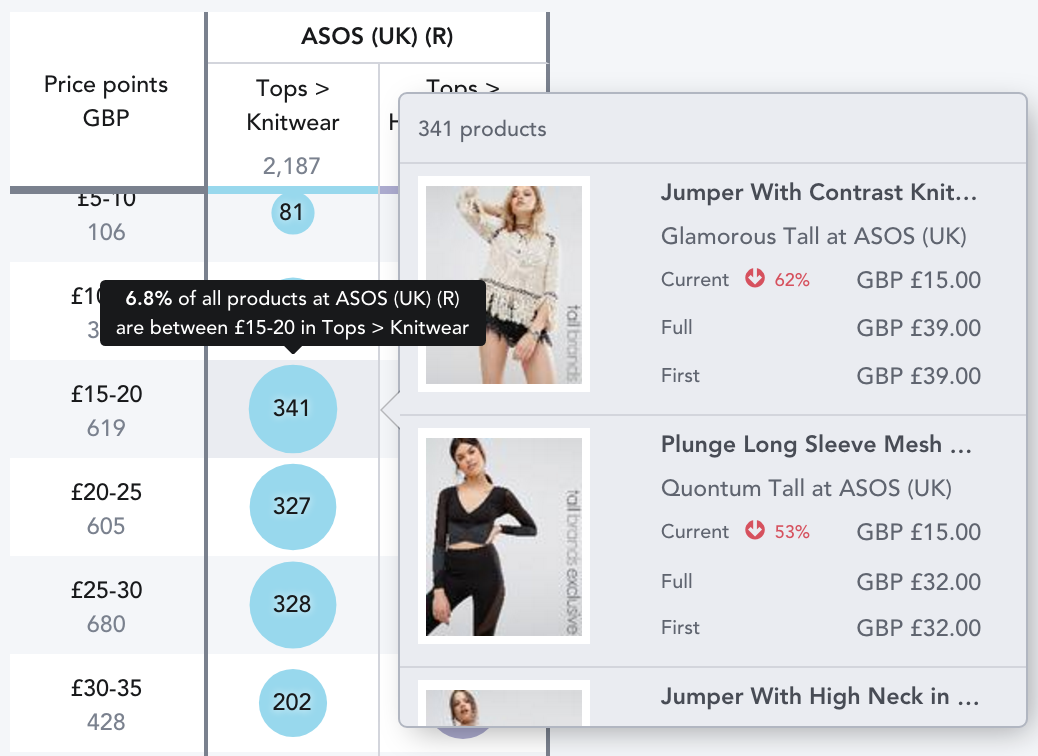
Click on the numbers in the chart to see the products at that price point. You'll also see a pop-over explaining what that bubble represents.
You can customize the charts further by using the additional chart controls at the top of your workbook:
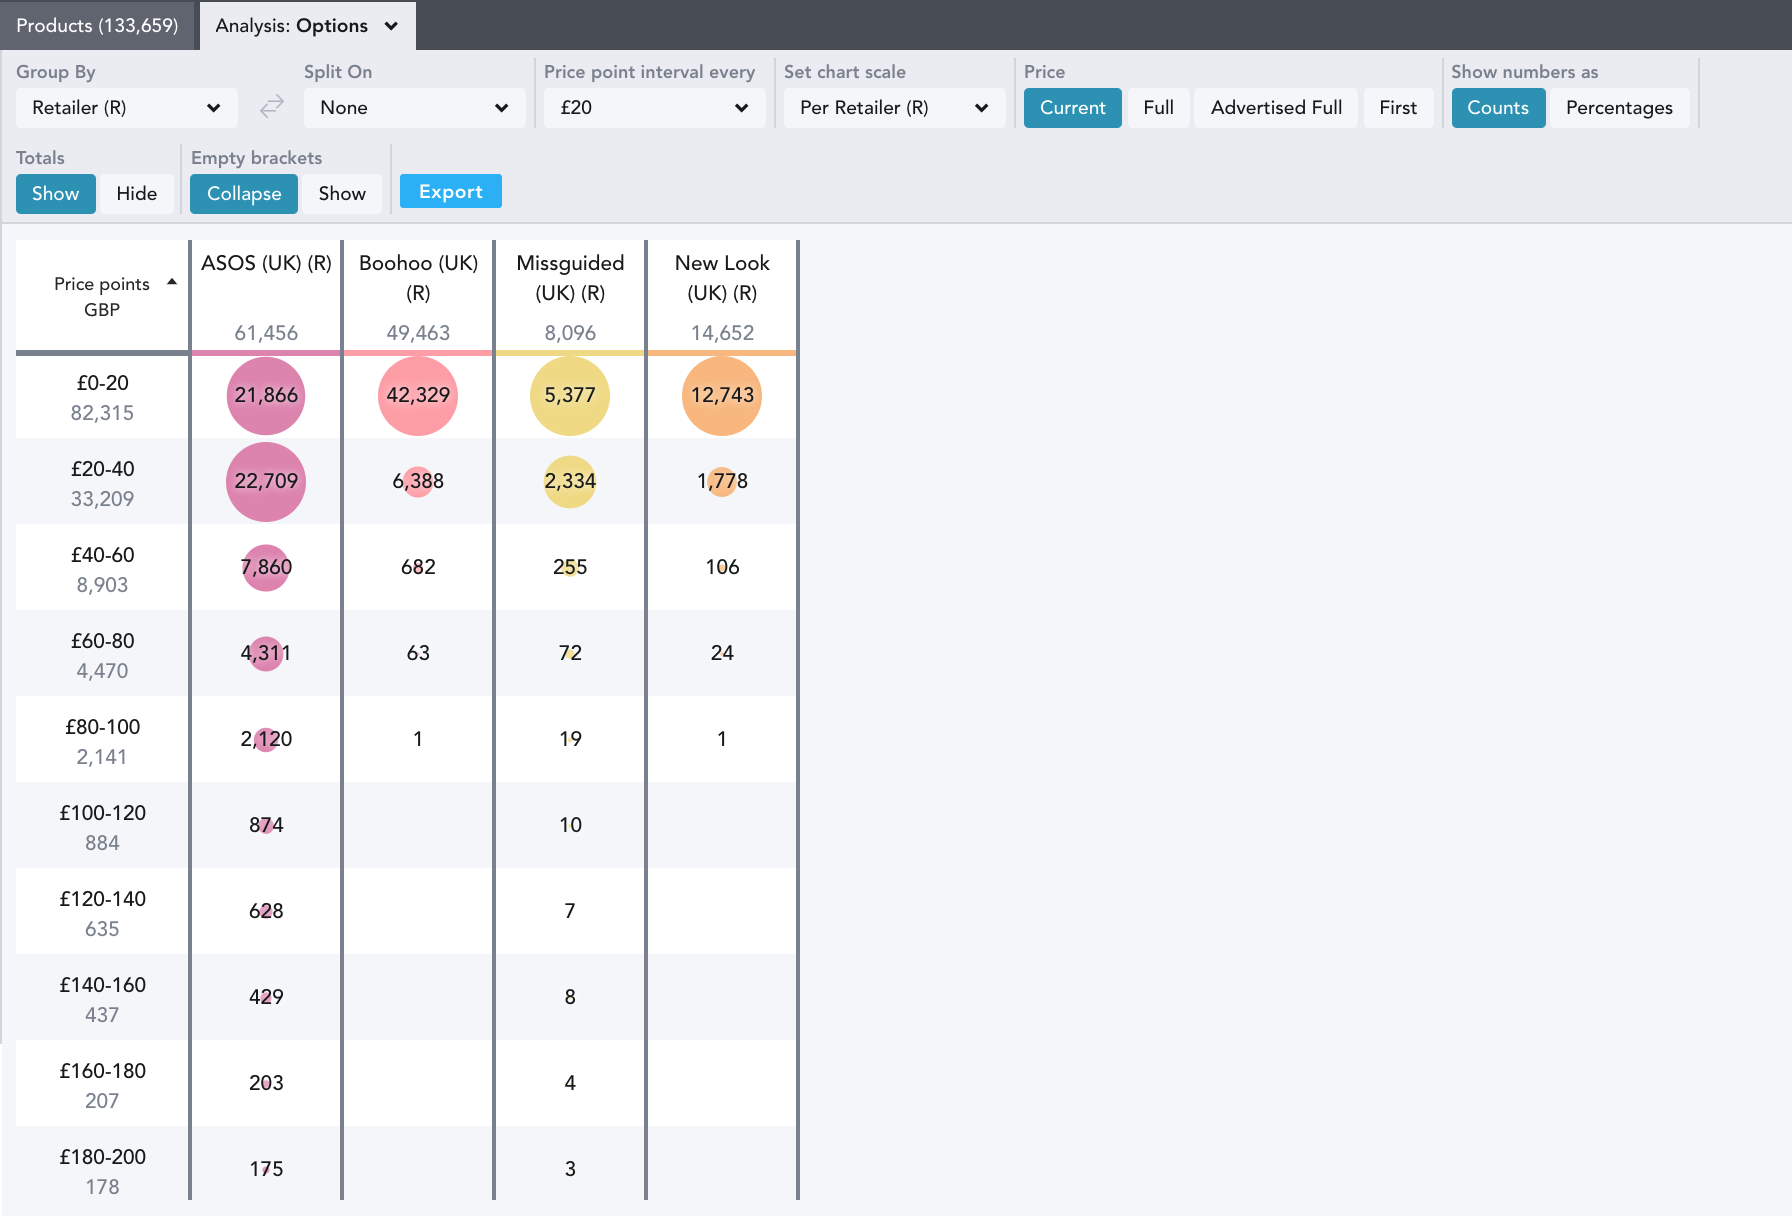
Set the scale of the bubble chart by selecting this from the dropdown menu. The chart above is scaled per Retailer, meaning that the size of the bubbles is scaled at each retailer individually rather than across all.
Switching between Products and Options within Count changes the units counted. Selecting products will show the number of unique items on the market at each price point, whereas options shows the number of variations (e.g. colors/patterns) at each price point.
When looking at Brands within a Retailer use the Show totals button to see totals across each price interval.
Clicking the Group button within Empty Brackets removes rows of price points where no products are present. Check out the video below to see how this changes your results -
You can also choose to Export the options chart into a csv. format. Save your workbook, and select the blue Export button. The following message will appear, and the csv. will be sent directly to your email address.

If you spot any prices that appear to be incorrect, please contact support@edited.com.