To view Discounts add a new tab to your workbook by selecting the + symbol:

Then select Discounts:

Discounts shows the percentage of products within your workbook that have a price reduction (discount) against them.
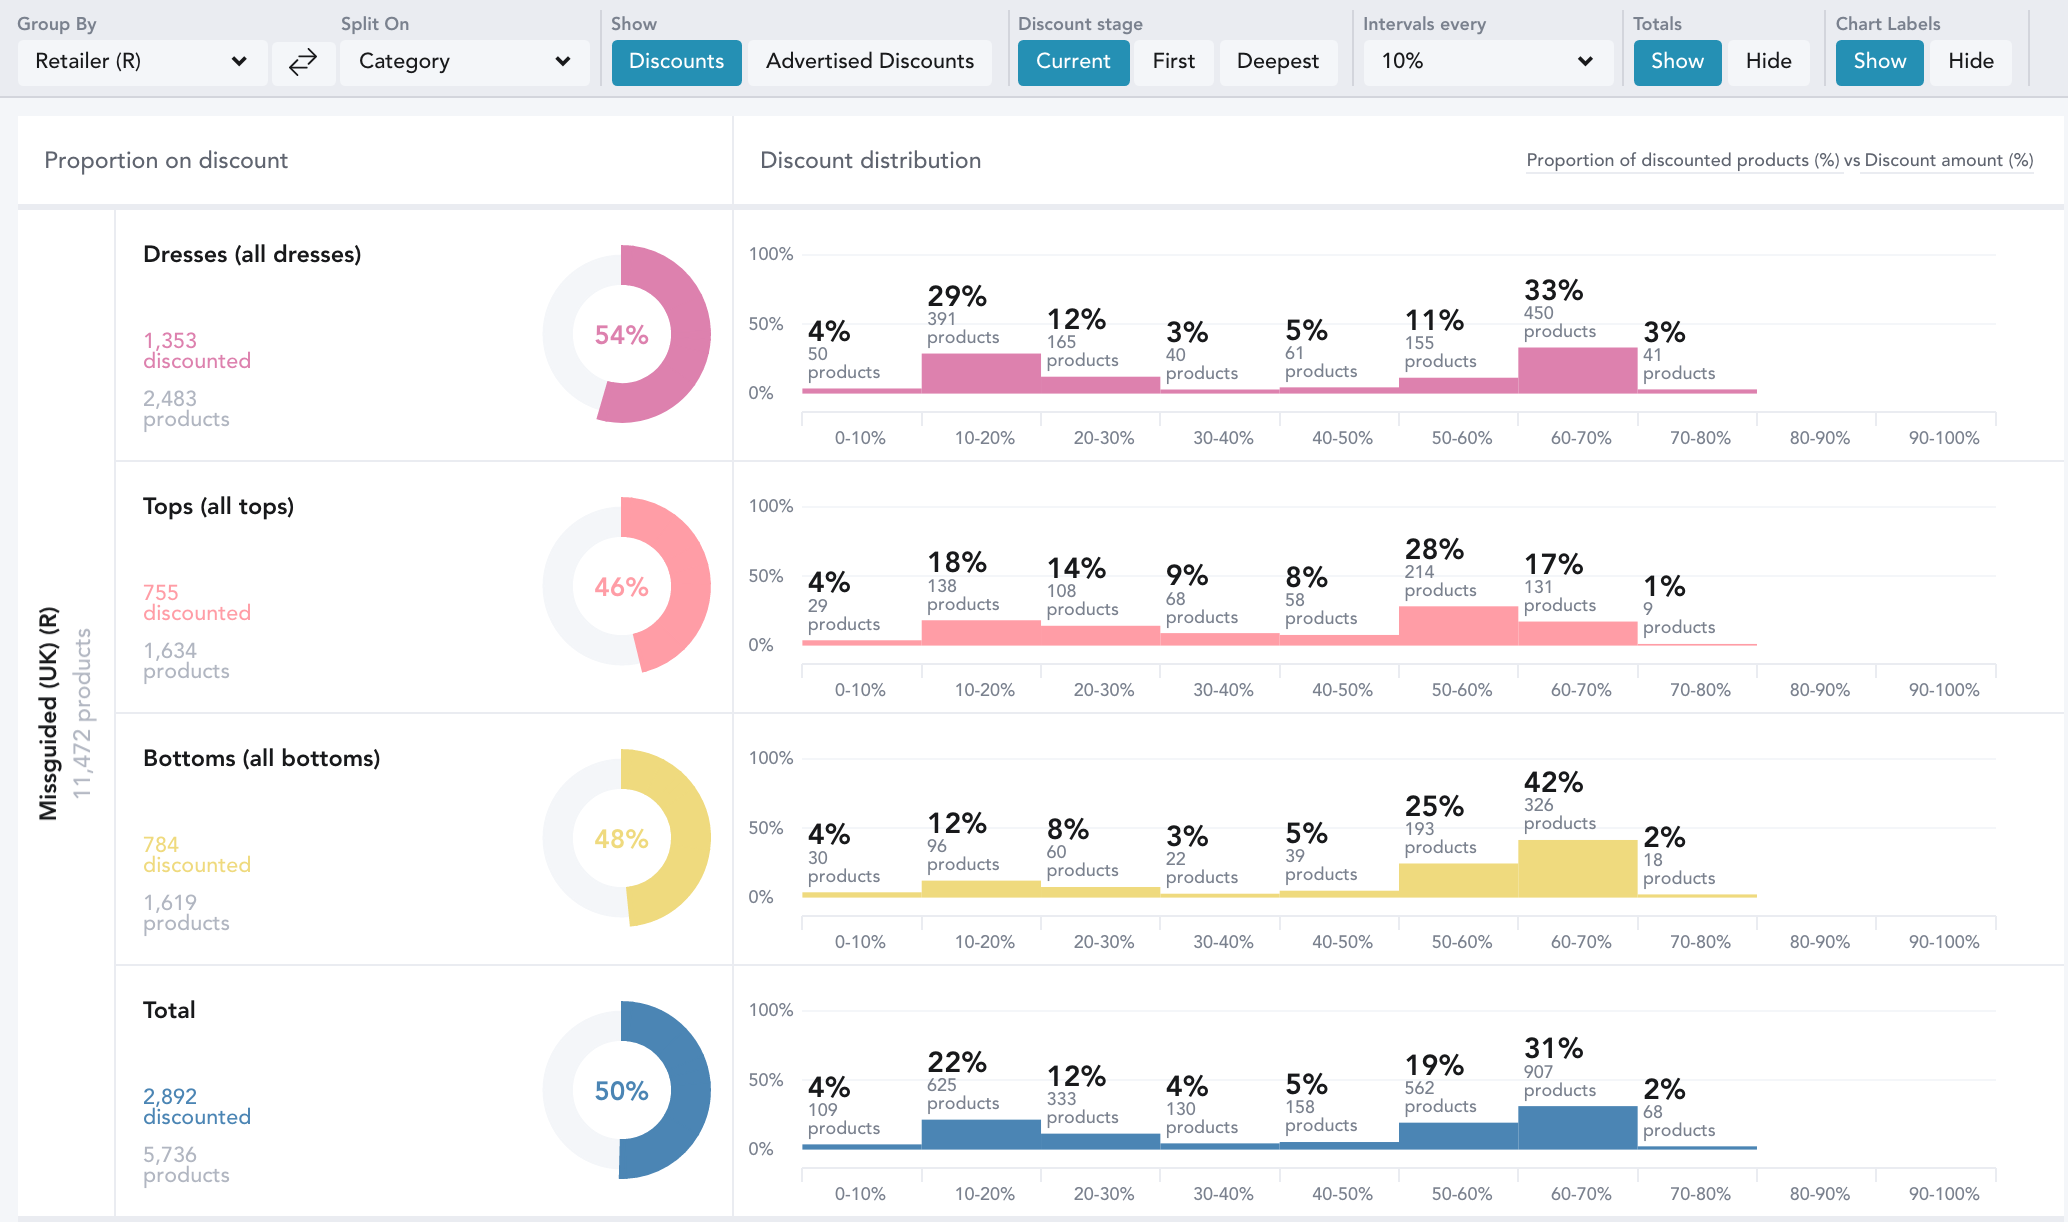
The pie chart on the left shows the percentage of products within your workbook that have been discounted. The graph on the right shows the distribution of discounted products within your workbook in customizable percentage intervals.
Each interval will include products from the lowest percentage decimal in that bracket, up to .99% before the highest value of that bracket. For example, if your intervals are set to 10%, then all products with prices between 0 and 9.99% off will fall within this bracket. Products that are 10% off will fall into the interval above, 10-20%.
Product discounts are rounded up to the nearest decimal within the Discounts chart.
For example, if the interval is set to 10%, a product with a discount of 29.9% will be rounded up to 30% and appear in the 30-40% bracket.
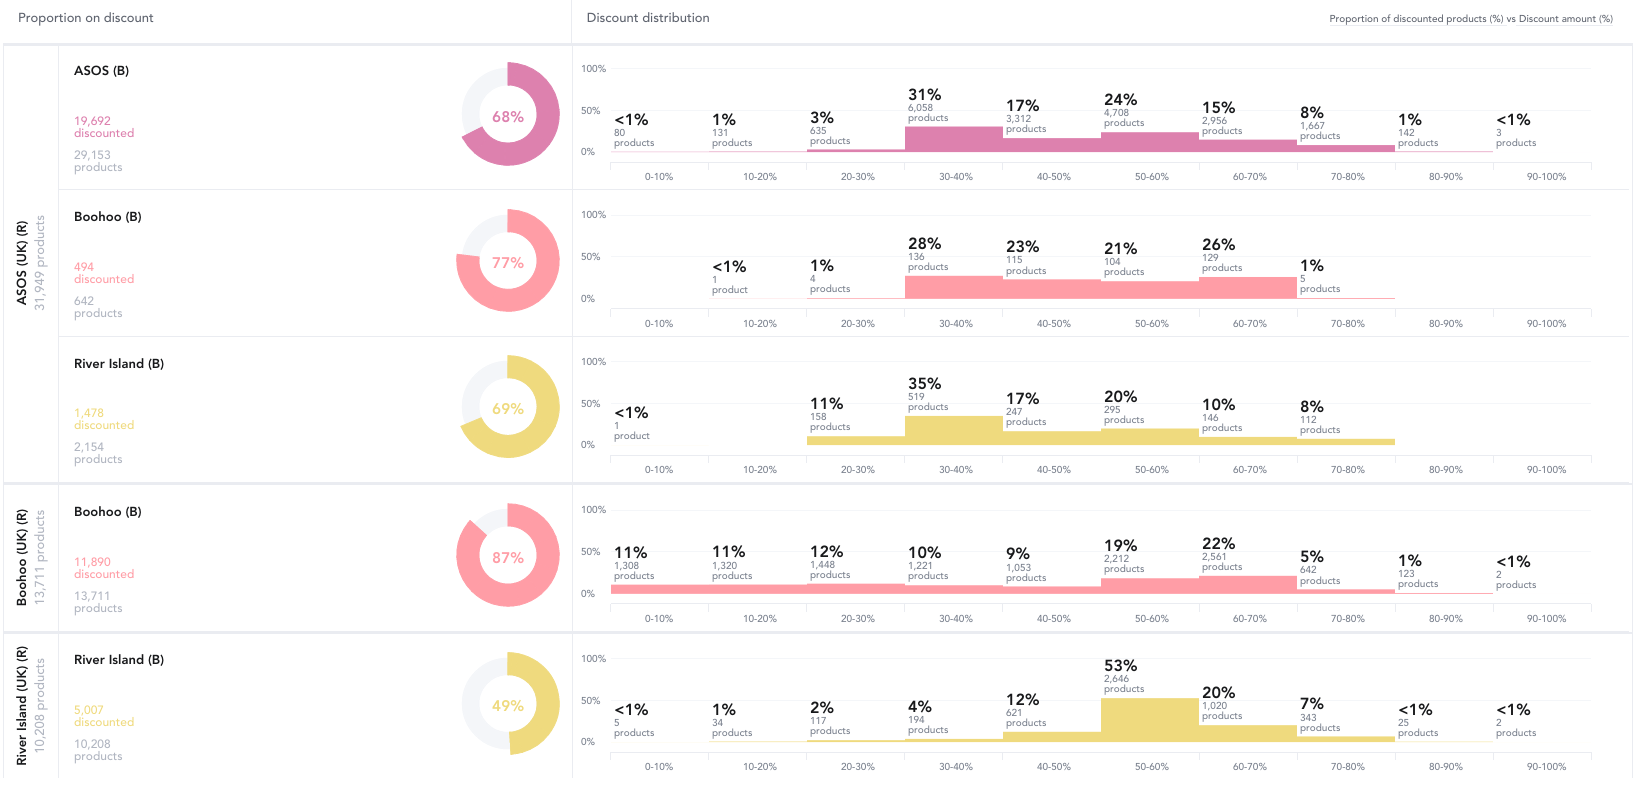
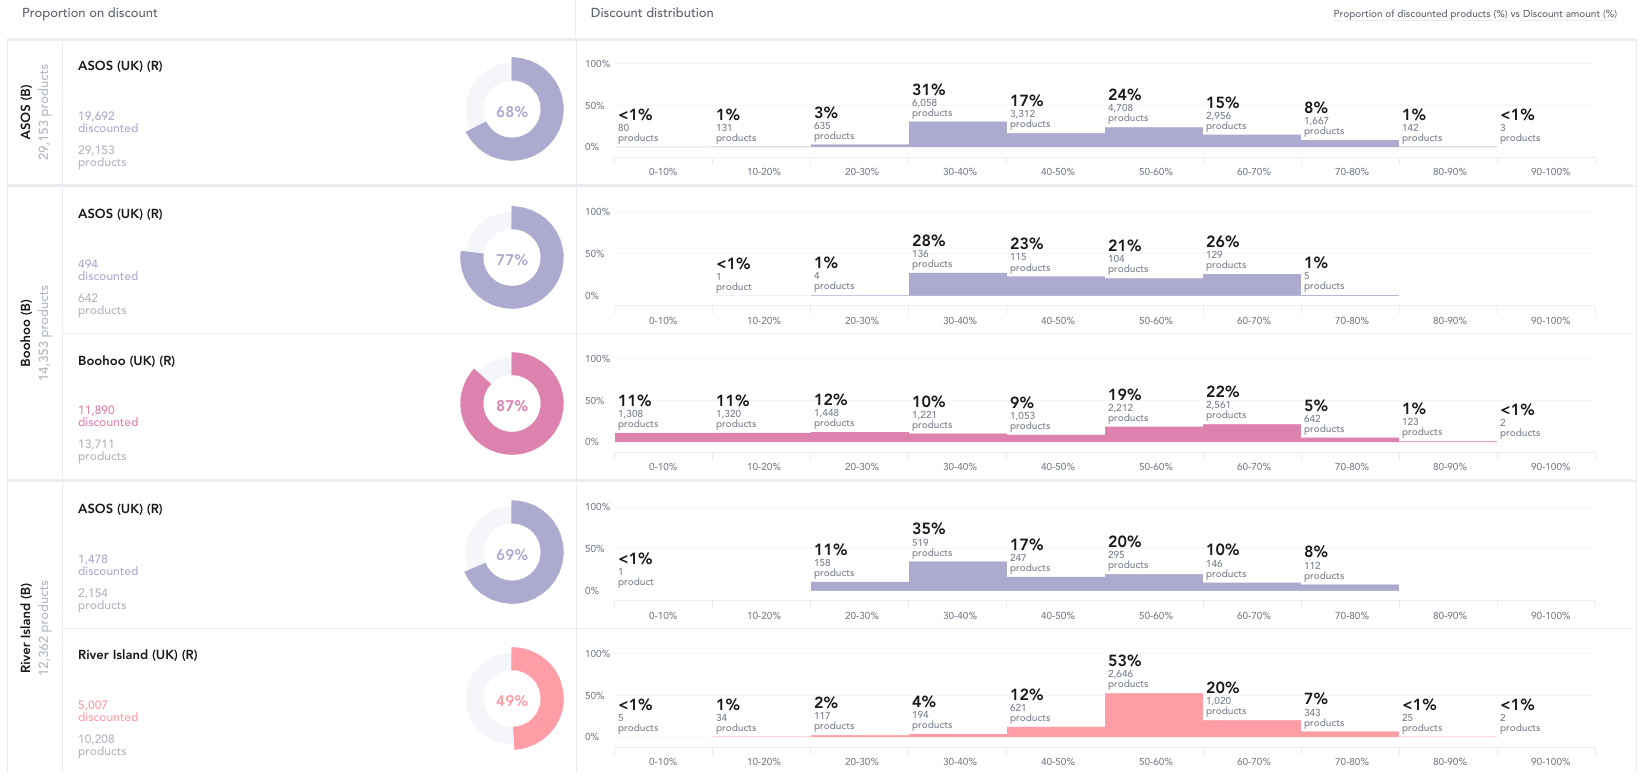
The charts can be grouped by brand or retailer provided that these have been selected in the control panel. If no retailers or brands are specified, the graphs will represent the number of items at each discount interval across the whole market. Grouping the charts by retailer shows price distribution of the brands within each retailer, whereas grouping by brand shows discount distribution of the brand between retailers. You can choose to view the data as an aggregate or split by retailer or brand. Here is an example of a chart grouped by brand:
The Inervals every dropdown will allow you to adjust the discount inervals you view in the chart. You can chose from the options or create a custom interval.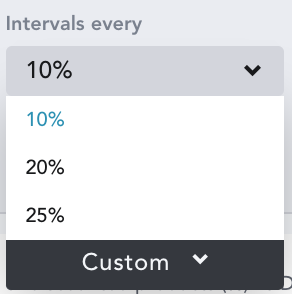
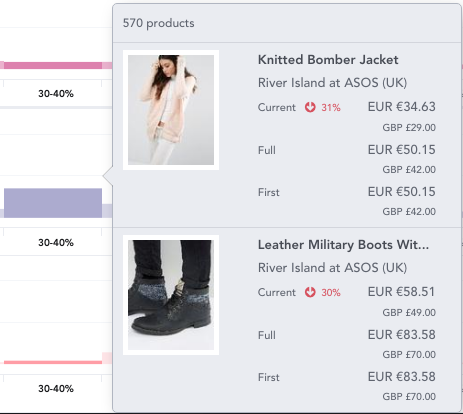
You can hover over the discount interval to see a popover of what that interval represents: 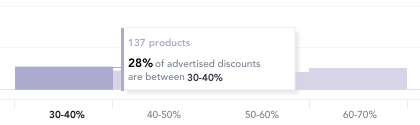
You can customize the charts further by using the Chart Controls at the top of your workbook:

Use the Group By and Split On drop downs to see your data by-
- Aggregate: see all the products in your workbook represented
- Region: see the data by each region selected in your workbook
- Segment: see the data per market segment selected in your workbook
- Retailer (R): see the data per retailer selected in your workbook
- Brand (B): see the data grouped by the brands selected in your workbook
- Gender: see the data per gender selected in your workbook
- Category: see the data per category selected in your workbook
- Product Details: see the data per product detail selected in your workbook
- Keywords: see the data per keyword grouping in your workbook
- Patterns: see the data per pattern selected in your workbook
- Flash Sales: see the data per flash sale selected in your workbook
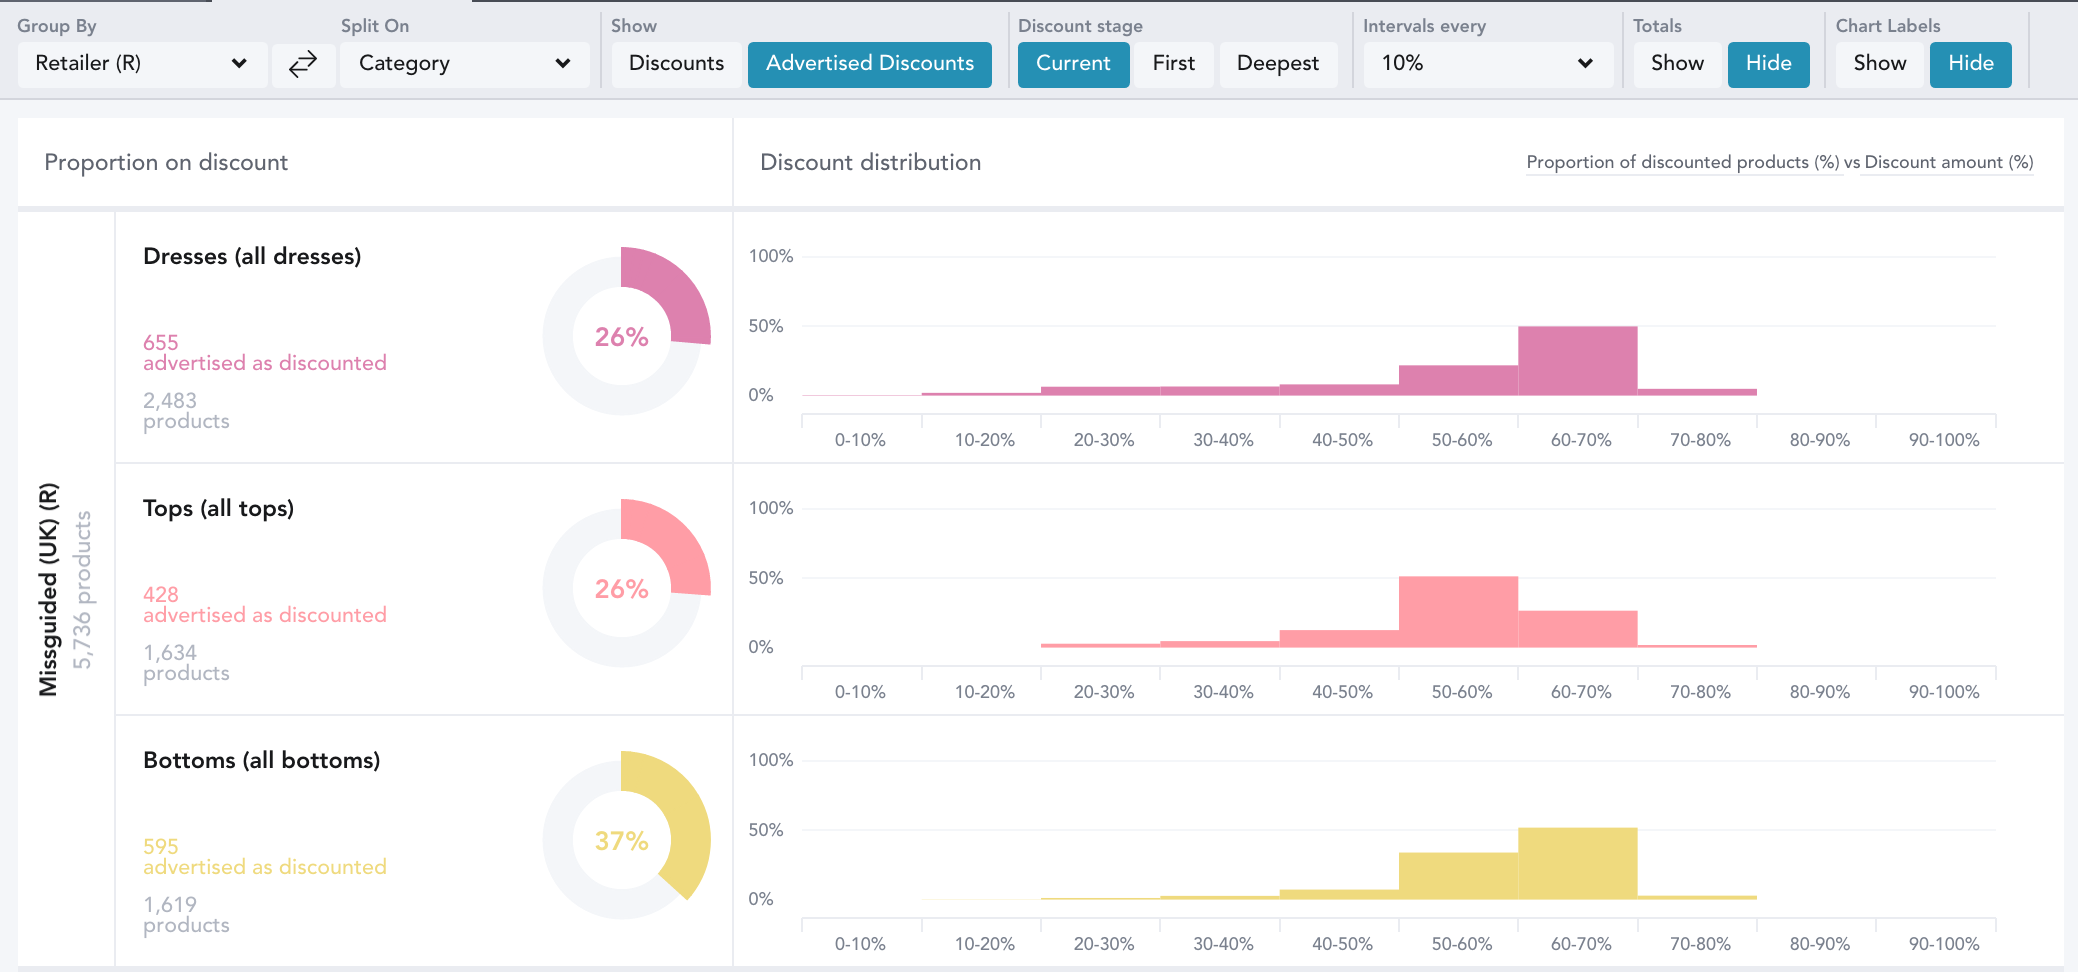
In the video below, the data is being grouped by retailer and split on the categories selected -
Choose whether you want to see Discounted products or products with an Advertised Discount.
When looking at brands within a retailer, use the show totals button to see totals across each discount interval:
If you want to remove the popovers on the Discount Distribution graph, hit Hide on the Chart Labels option. The screenshot below shows a graph without chart labels: