Watch the video below to learn how to use EDITED's Colors feature.
To view Colors, add a new tab to your workbook by selecting the + symbol:

Then select Colors:

Colors shows the assortment of color as per the products in your workbook. You can view this as an aggregate or split it out further using EDITED's Chart Controls.
Use the Group by drop down to change the view:
- Aggregate: see all the products in your workbook represented on the color wheel
- Region: see the color wheel per region selected in your workbook
- Segment: see the color wheel per market segment selected in your workbook
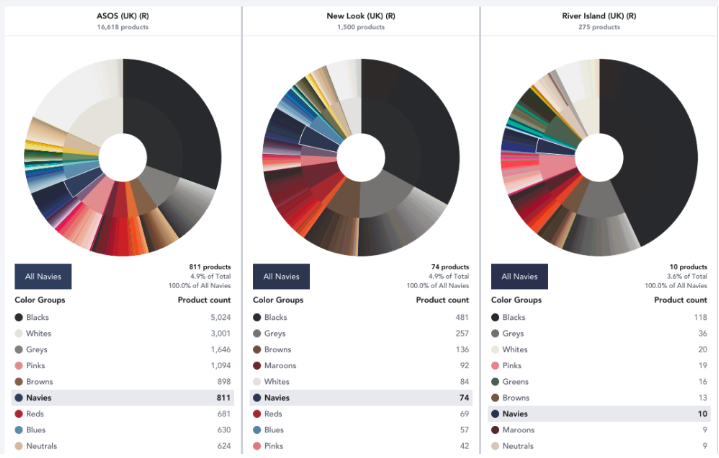
- Retailer (R): see a color wheel per retailer selected in your workbook
- Brand (B): see the color wheels grouped by the brands selected in your workbook
- Gender: see the color wheel per gender selected in your workbook
- Category: see the color wheel per category selected in your workbook
- Product Details: see the color wheel per product detail selected in your workbook
- Keywords: see the color wheel per keyword grouping in your workbook
- Patterns: see the color wheel per pattern selected in your workbook
- Flash Sales: see the color wheel per flash sale selected in your workbook
You can then use the Split on dropdown to get an even deeper understanding.
Below is a video of these chart tools in action. The data is first grouped by the retailers selected and then split on the genders selected. Clicking on the 'switch' button then shows the data grouped by retailers and split on gender.
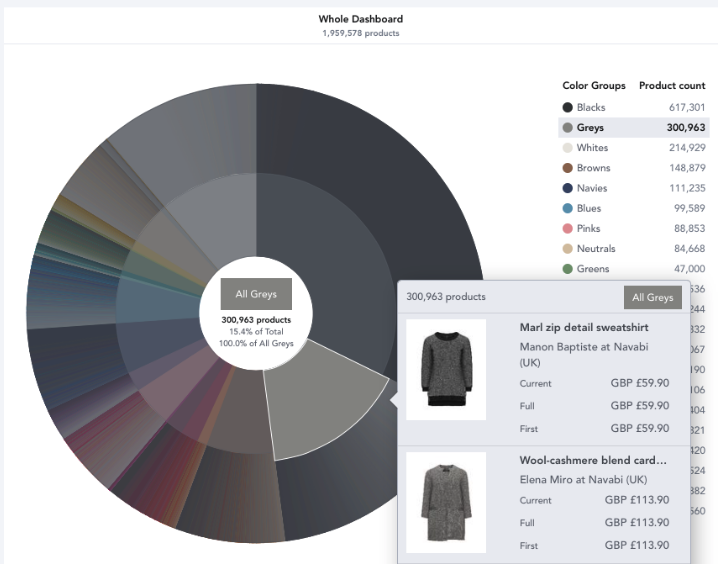
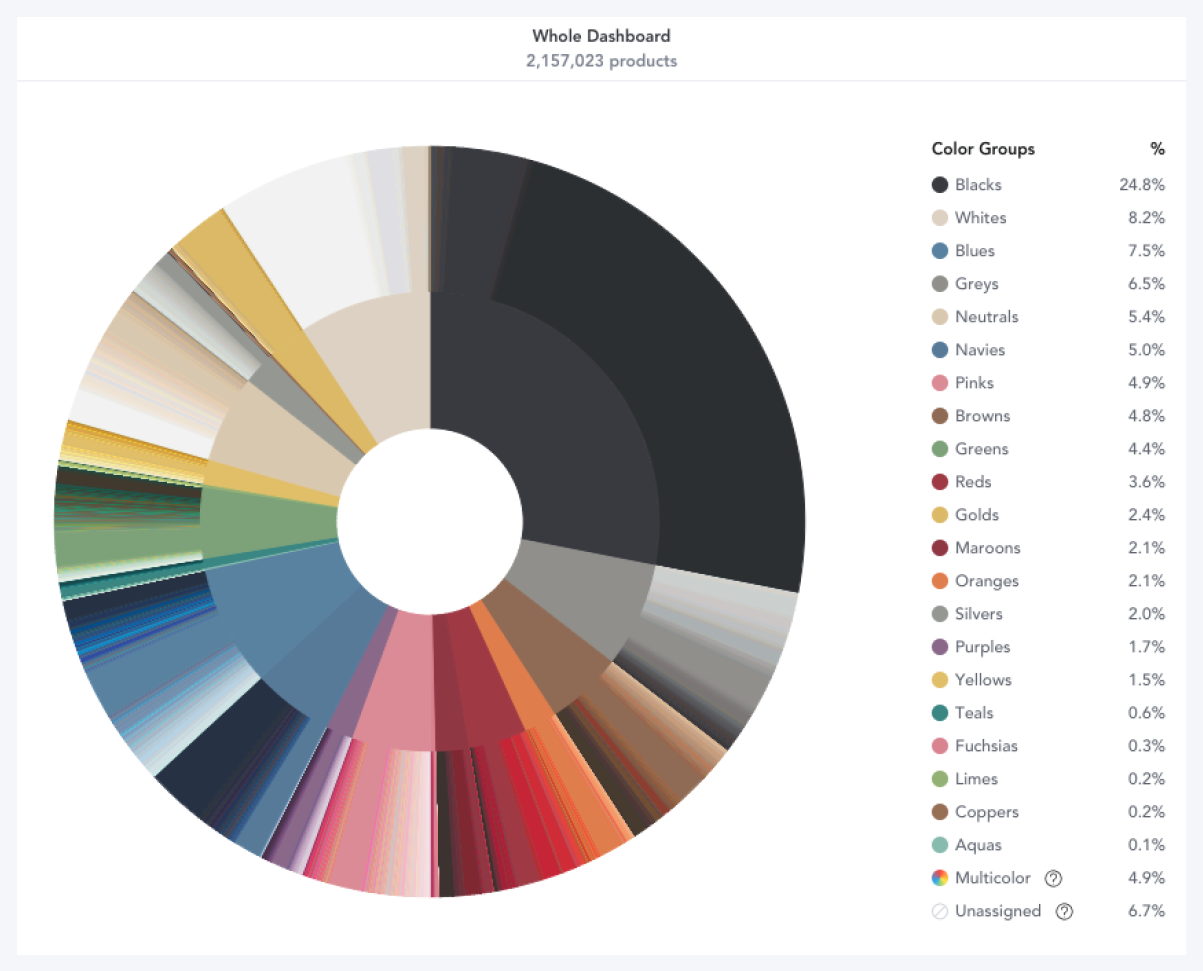
The inner circle shows the average color of all the individual colors in the outer circle of that section. The outer circle shows all the different shades that products are available in. The key shows how many products, or percentage of products, per color group. Each segment is proportional to the amount of products it represents and you can click anywhere to see the products. You can also hover or click on color groups in the key to see the relevant segment highlighted on the chart and the products.
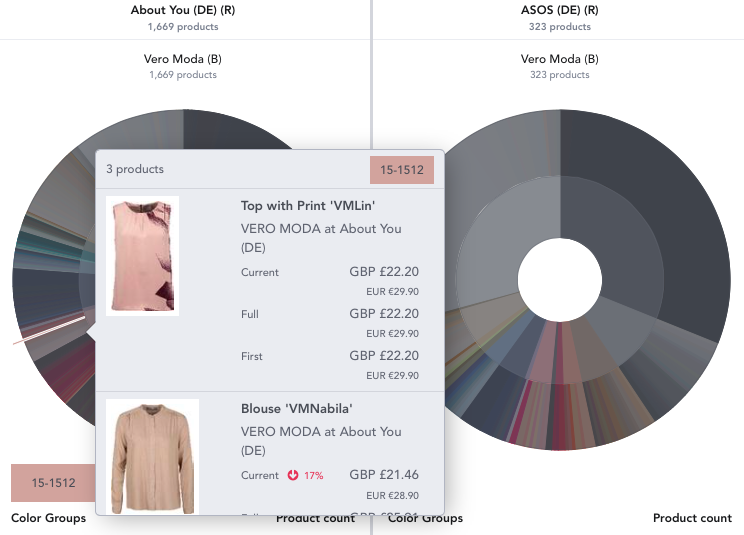
Clicking on the outer circle will show the color code for specific products, below we can see red products matching the color code 18-1664. Use the Counts and Percentages buttons at the top to switch between seeing the colors related to the number of products or as a percentage of your workbook.
Below the charts are grouped by Retailer. Hovering over a color listed below a chart will highlight it across all retailers and on the carts, so you can easily see it. Here we've hovered over Navy; you'll also notice a summary below each chart with details on how many products available at each Retailer in this color group and what percentage this represents of their total assortment.
Click on a chart to view products. This will also display the color code of the products selected.