-2.png?height=120&name=EDITED%20Logo%20Dark%20-%20Color%20(1)-2.png)
Action Impact Overview
Action impact is intended to measure the difference in profit or sales over what would have occurred if an action had not been taken. To measure Action Impact, DynamicAction first attempts to observe actions that have occurred. Has the average selling price of a product changed (either through markdown, promotion or the removal of a promotion)? Has the SKU availability of a product changed (e.g. key sizes, col
ors, materials have been replenished or sold out)? Has the relative percentage of product views to an item changed in comparison to the product’s category peers? If yes, DynamicAction logs the observance and then attempts to estimate its impact on profitability and sales.
On the web, profitability and sales are primarily impacted by changes in efficiency and exposure. When you drop the price of the product or increase the availability of a product, you are commonly doing so in attempt to increase its selling efficiency. The hope is that a higher conversion rate will offset the costs of the action. If exposure were free and limitless, then boosting exposure for a product would always be a good thing. Yet, adding exposure through paid external marketing is certainly not free. Adding exposure by shifting views from Product “A” to Product “B” will help “B,” but hurt “A.”
Thus, to measure the impact of your actions, DynamicAction runs through a series of algorithms to help identify the actions that were winners or losers. If we decrease the average selling price of an item, did we increase efficiency (product profit/view or sales/view)? If we increase availability for an item, did we increase efficiency? If we shift exposure from one item to another, did we shift views away from below average efficiency items to above average efficiency ones? Generally speaking, if the answer to the above questions is “yes” then we are observing winning actions.
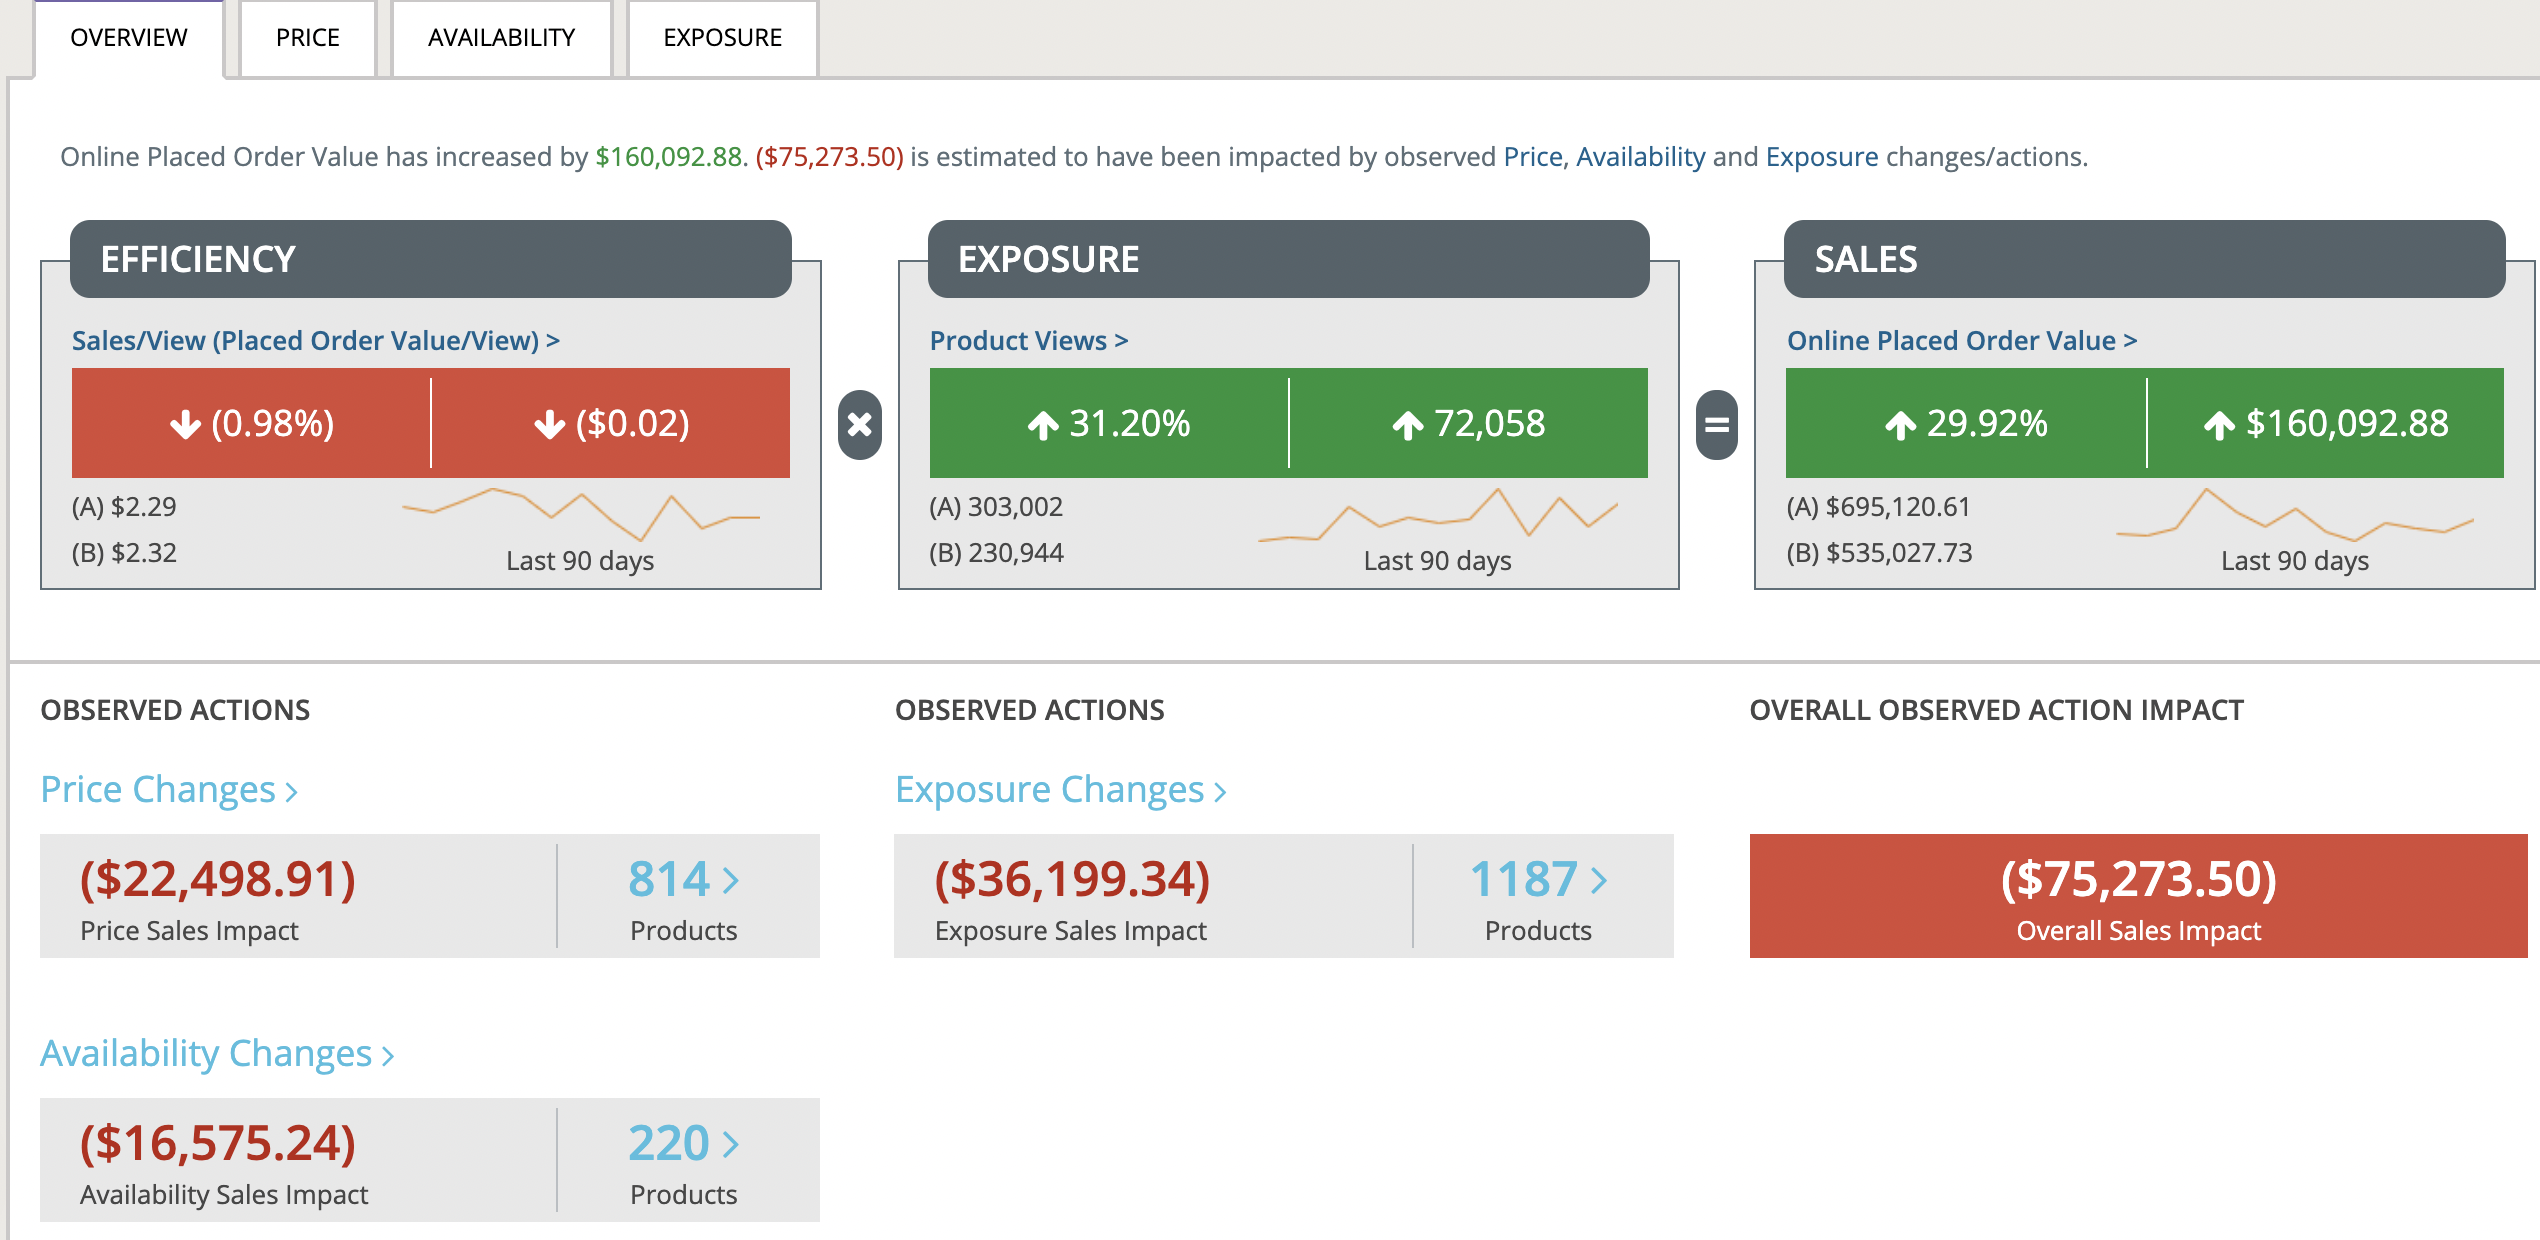
The Overview page highlights the overall changes in profit or sales. It also reveals whether or not the change was primarily the result of changes in efficiency or exposure. Then, within those buckets, it highlights the number of products and the estimated impact observed from Price, Availability and Exposures changes. Actions are unlikely to explain all of the change. For example, seasonality may play a big role in changes to raw traffic which isn’t a result of an explicit action taken during the time period.
Quadrant View
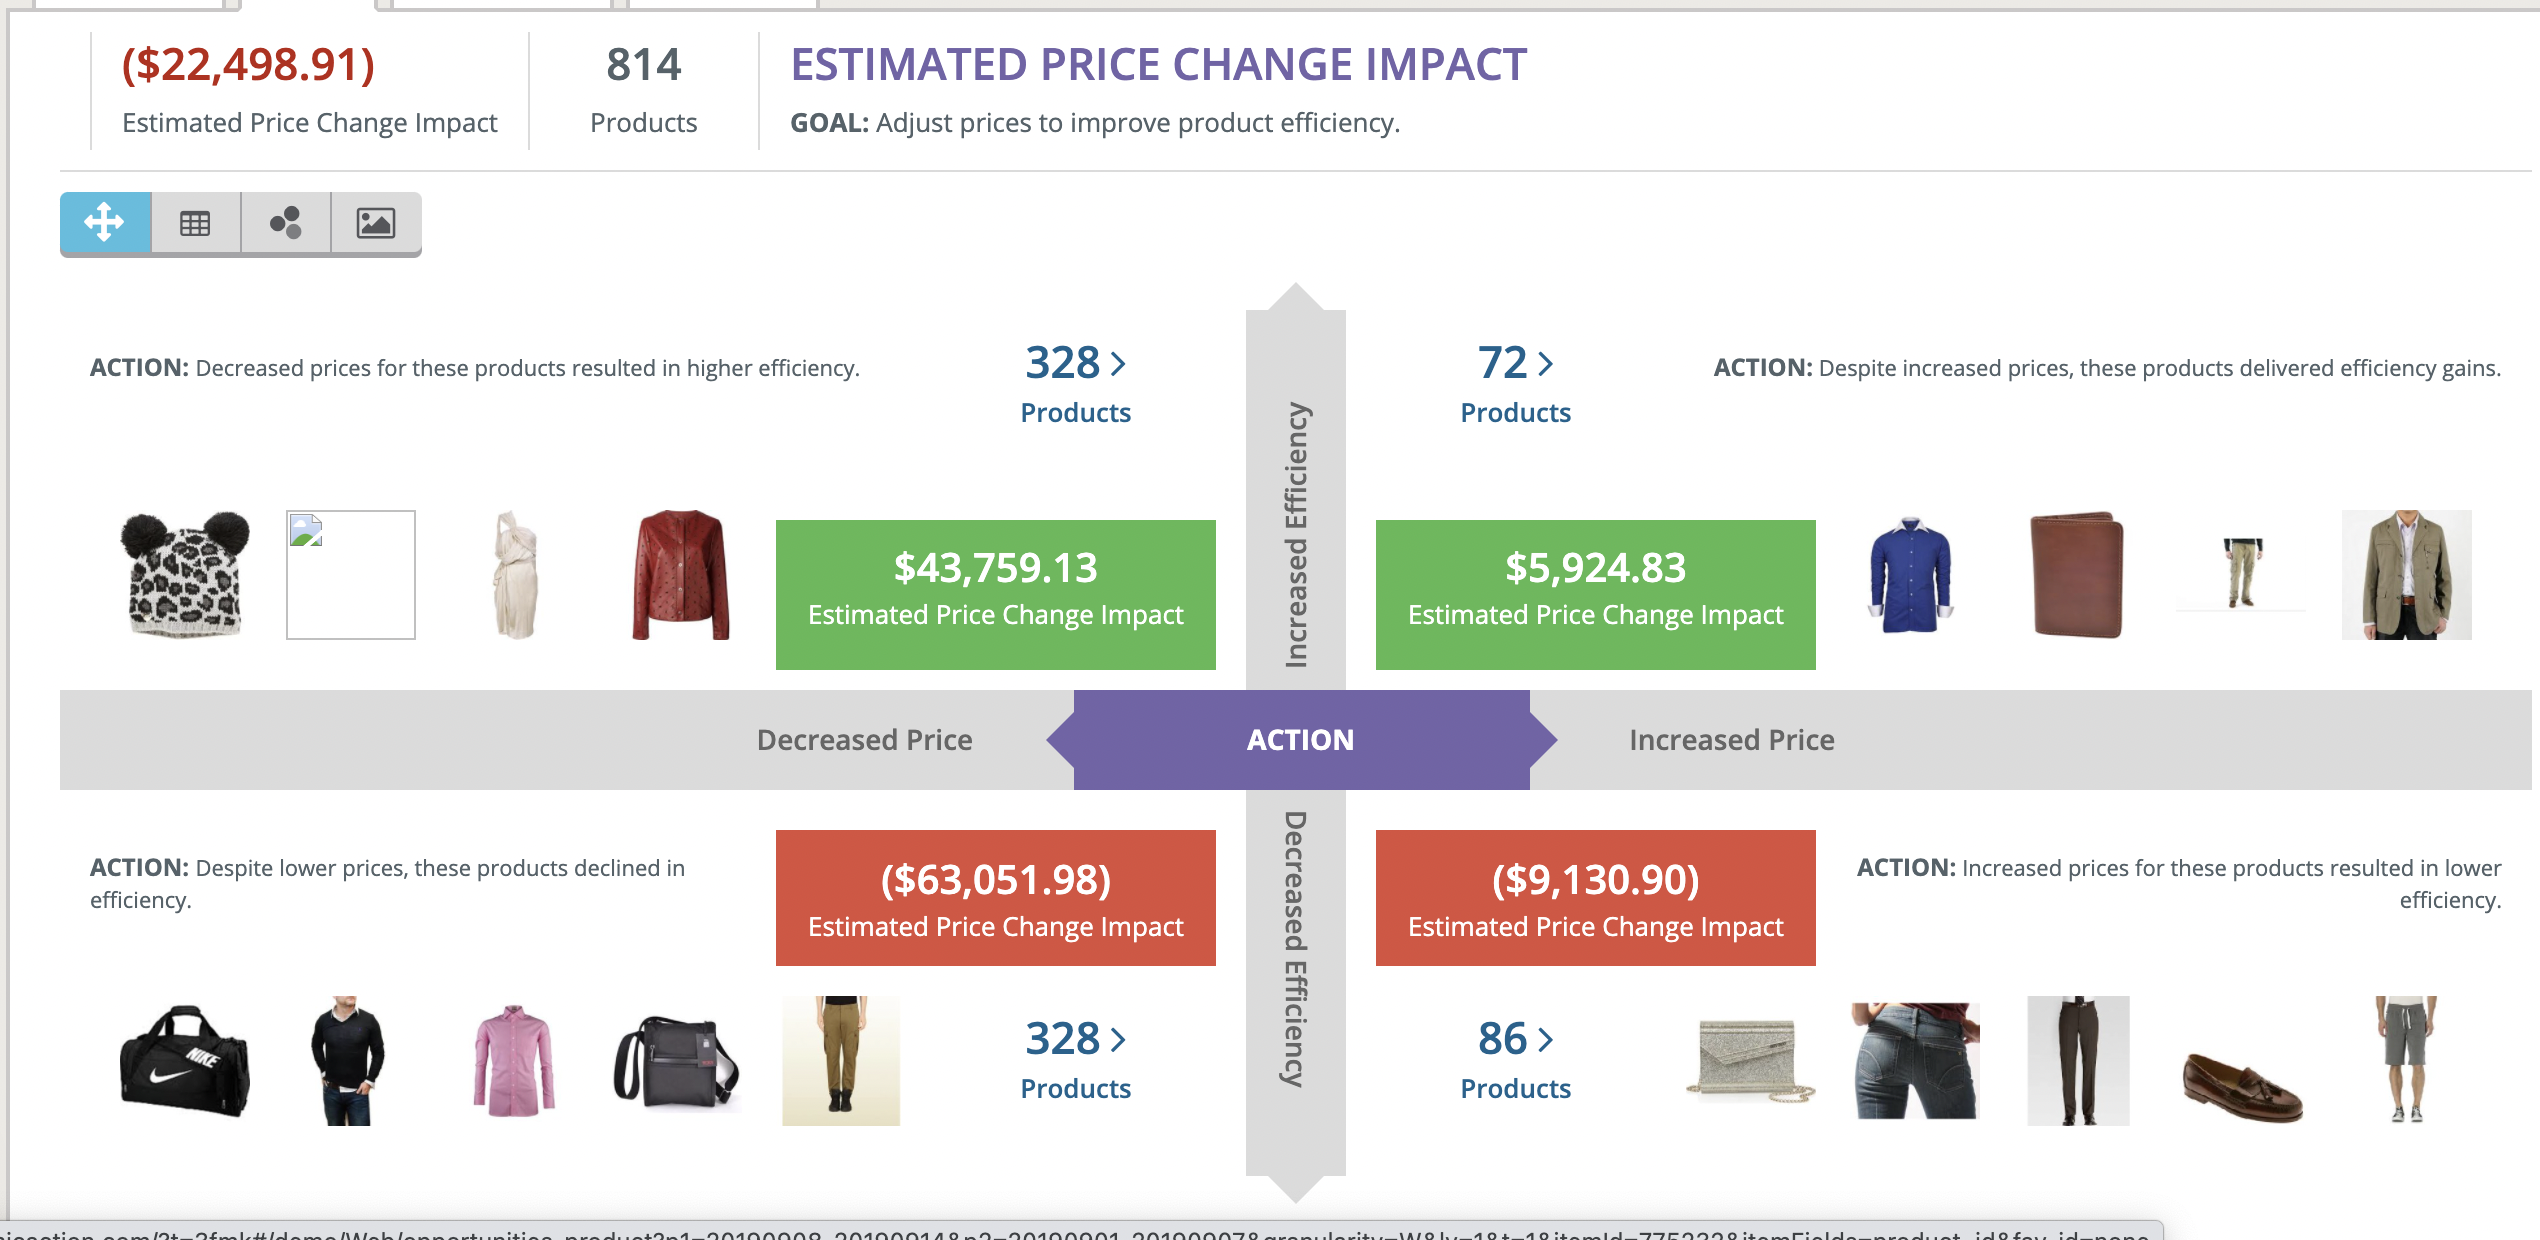
The quadrant view explains how many products benefited and didn’t benefit from the actions. It also communicates the degree of action success or failure via the estimated impact on profit or sales.
Grid View
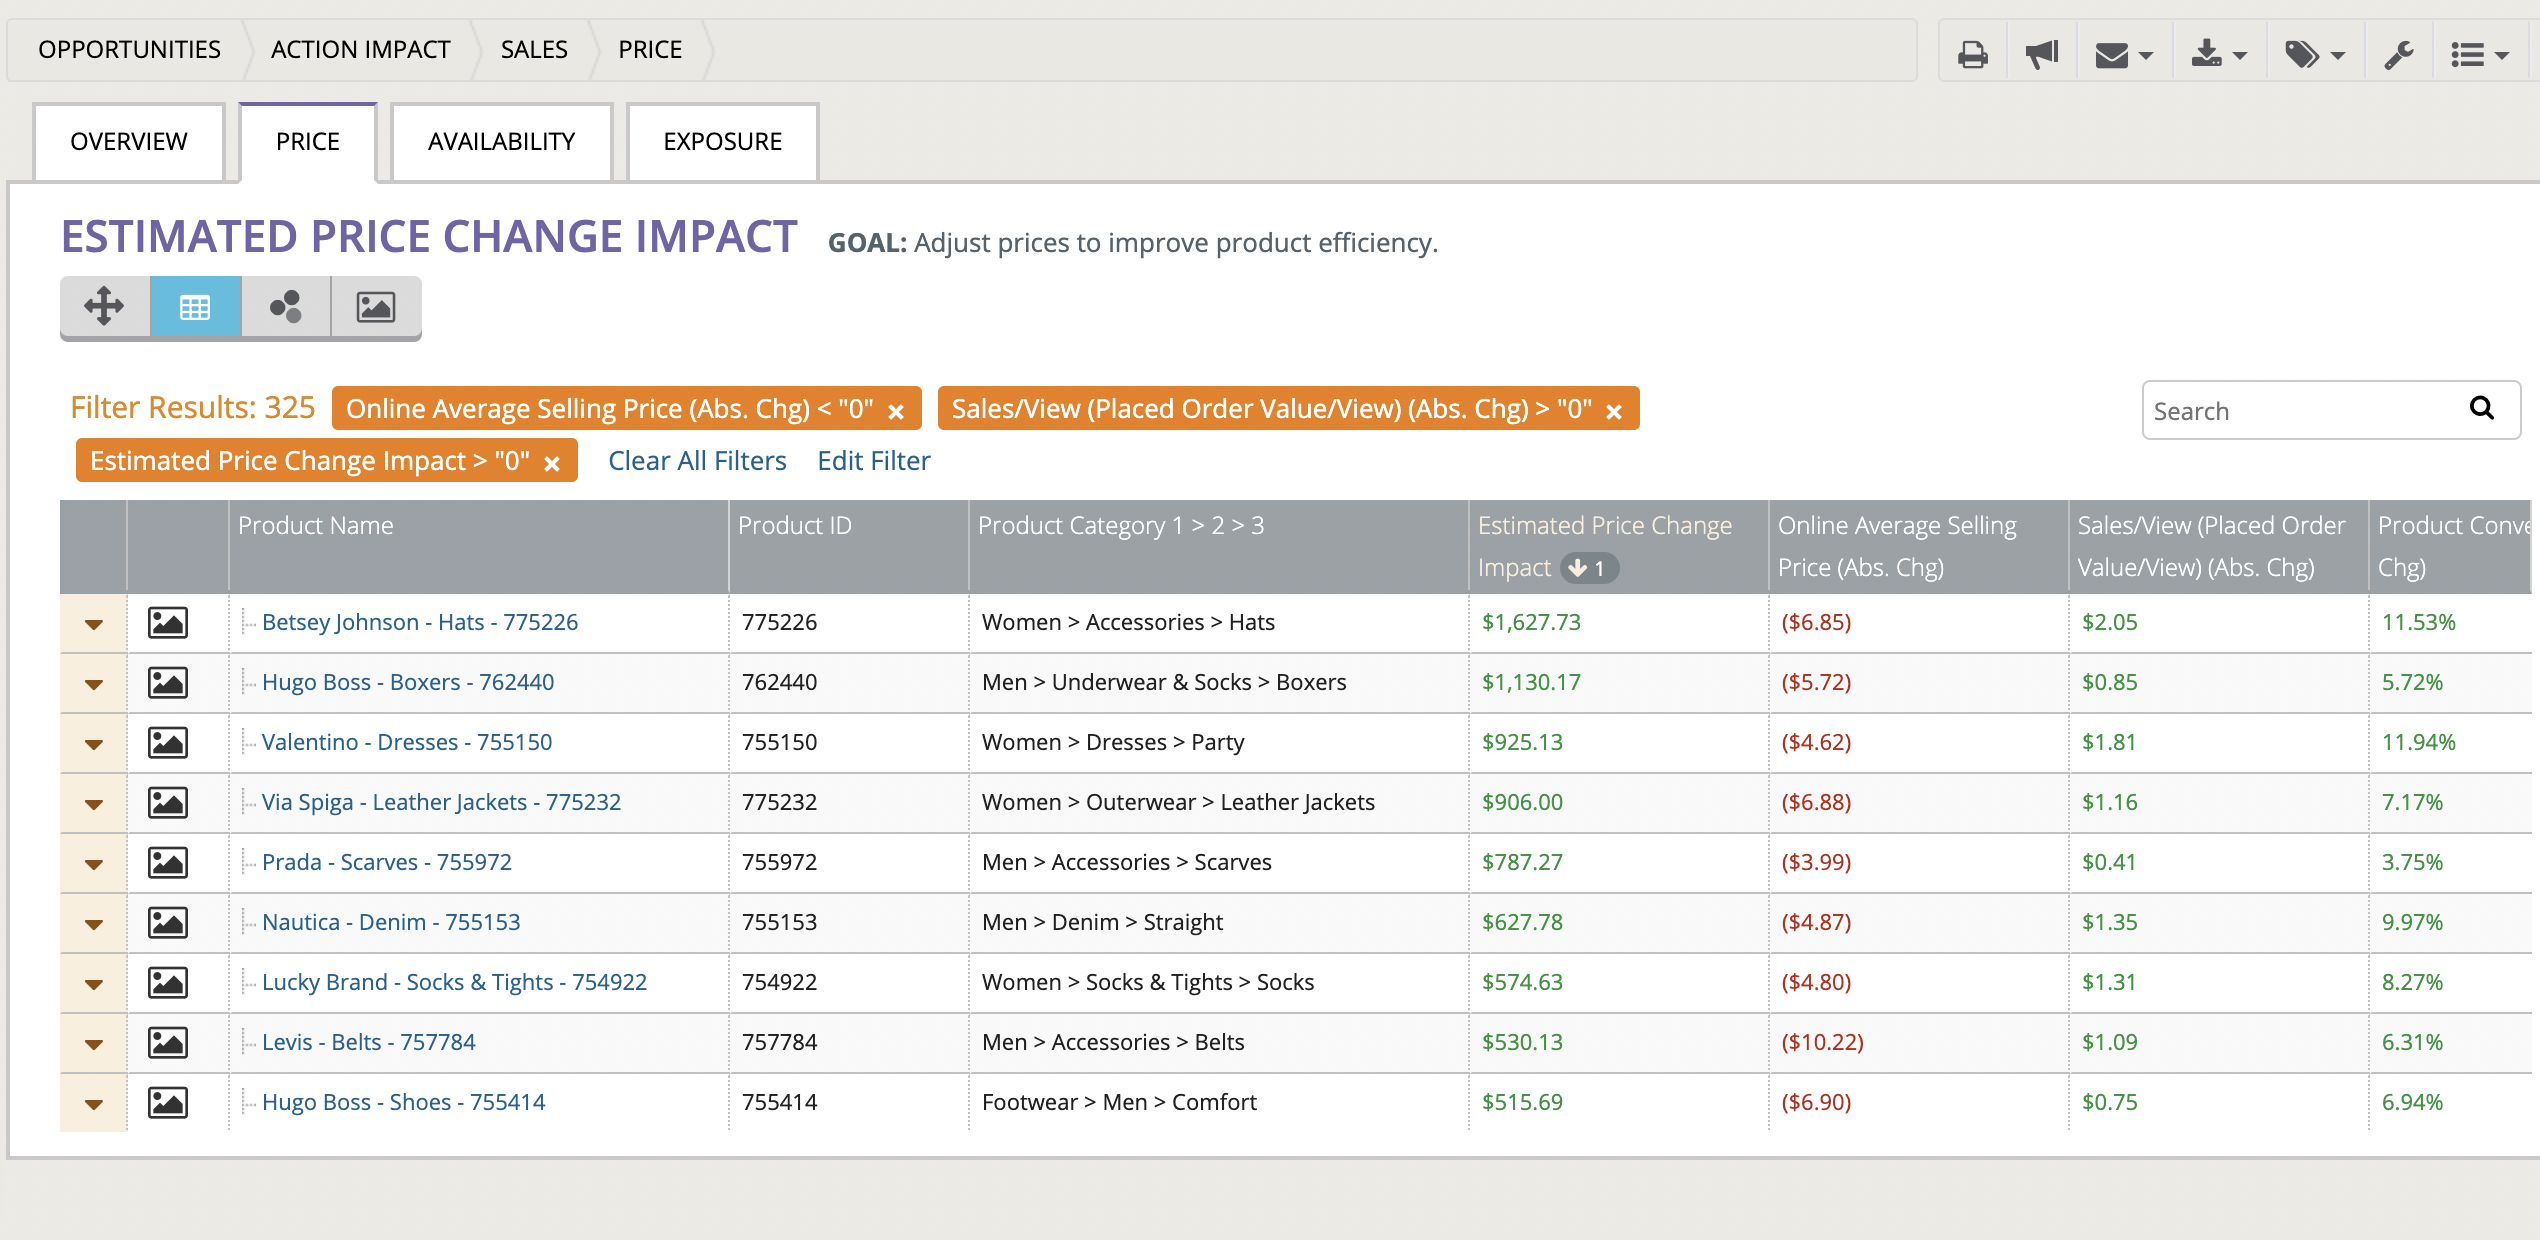
Drilling down or toggling to the grid views offers a line item, row level detail. These grids help to answer your specific questions. For example, Product “X” was identified as an increase exposure candidate. Thus, we increased views to it by changing its sort ranking and where it fell in search results. Did these changes prove to have a big impact positive impact on profit and sales? In other words, did the action work and should I continue to do more like it? Note: The grid pages also support Item Alerting, Downloads and Recurring Email.
 Price Impact
Price actions are observed when DynamicAction identifies that average selling price has changed (either through markdown, a price increase, a promotion or the removal of a promotion) by at least 3% (default threshold). Generally, the goal of a price drop is to increase selling velocity and thus efficiency. If a promotion is removed or a price increased, the hope is that it can be done while stabilizing conversion.
 Availability Impact
Availability actions are observed when no price change actions have been observed and SKU Availability changes (either through replenishment or selling through key sizes, colors, materials, etc) by at least 3% (default threshold). Generally, the goal of an increase in SKU Availability is to increase selling velocity and thus efficiency.
 Exposure Impact
Exposure actions are observed when DynamicAction identifies that the relative percentage of category product views has shifted by at least 3% (default threshold). For example, if a specific blender received 5% of the product views to the Small Kitchen Appliances category last week and then received 5.2% of the product views this week, then it would qualify since that represents a 4% change. Generally, the goal of relative category exposure shifts should be to increase the percentage of views to above average efficiency items and decrease the percentage of views to below average efficiency items. This can be accomplished through sort order changes, search results changes, changes to what is show in product recommendation zones, external marketing changes and more.